Statistical Analysis of the Position Tolerances of Planet Pins in Planetary Gearboxes
Manufacturing processes are not perfect and are subject to deviations. These deviations occur in all forms and are limited by tolerances. Tolerances are described in standards such as ISO 1101 (Ref. 1) or ASME Y 14.5 (Ref. 2). Tolerance ranges are standardized for various manufacturing processes, such as shaft tolerances in DIN ISO 286 (Ref. 3) or center distances in DIN 3964 (Ref. 4).
In most cases, the deviations follow a normal distribution, as described by Equation 1, where σ is the standard deviation and μ is the nominal value. The standard deviation is a measure of the scatter of the values around the mean.
(1)
The positions of the planet pins in the planet carrier are also subject to tolerances. It is known that uneven distribution of the planets around the circumference leads to uneven load distribution. According to ISO 6336 (Ref. 5), uneven load distribution due to deviations can affect the load capacity of the planetary stage. In addition to deliberately implemented asymmetries, it can also be assumed that tolerances lead to a change in the load sharing between the planets.
The tolerances are mostly defined as geometric deviations from an ideal position. The definition for the tolerance is mostly done per part. In the context of catalogue gearboxes, the application and the requirements for torque density can change quite drastically. This means that a tight tolerance is not needed for every application.
If the geometric tolerances are not met, the parts are released using a simulation in a special release process. Both the customer’s requirements and the measured production deviations play a role in this process. The simulations are very reliable but generate a comparatively large amount of work.
This study uses a Monte Carlo simulation to investigate the influence of tolerances on the load capacity. This simulation analyzes the safety of the planetary stage with variable planet pin positions and discusses the results, including the possibility of load-dependent tolerances for catalog gearboxes. The resulting surrogate model should facilitate a determination during the measurement process as to whether the part can be utilized for the order, whether it will be incorporated into another order, or whether it necessitates disposal.
Simulation Model
The simulation model and the theoretical approach used are explained below.
System Simulation
The simulation model is based on a quasi-static gearbox simulation with the FVA-Workbench 9.0.2. In this method, analytical models are used to simulate the behavior of gearbox components under load. Shafts are approximated as Timoshenko beams, rolling bearings as Hertzian contacts, and gear teeth as mechanical plates. The planet carriers are too complex to be meaningfully modeled using analytical equations, so they are modeled as reduced stiffness matrices according to Guyan (Ref. 6).
To obtain the displacements in the gear system, and thus the load distribution on the tooth flank, the stiffness is solved iteratively in a system of linear equations. The procedure is based on the RIKOR method (Ref. 7).
The overall system simulation determines the deformation of all components under load. The face load factor KHΒ and the load sharing factor Kγ for the calculation are derived from the stiffness characteristics of the mechanical system.
Conservative calculations are used for the design of the models presented in the Results and Discussion section. It is assumed that the largest face load factor and the largest load sharing factor in the planetary gear stage occur on the same planet. The load capacity is determined for this planet in accordance with ISO 6336. This study is carried out exclusively on one-sided planetary carriers. Errors caused by the assembly of two parts with tolerances are therefore not considered.
Tolerance Simulation
In the mechanical model, the planetary pins are connected to the side plates via coupling elements, which can be displaced in the radial and tangential directions. This changes the position of the pin and the planet. The influence on the gearing is considered, in particular on the center distance, backlash, and tip clearance. This reduces the amount of effort required for the meshing and the static condensation of the planet carrier. The carrier must only be prepared once in a pre-processing step before the simulation, enabling very fast simulations. In this paper, only one-sided planet carriers are investigated. For two-sided planet carriers, additional static misalignments would occur.
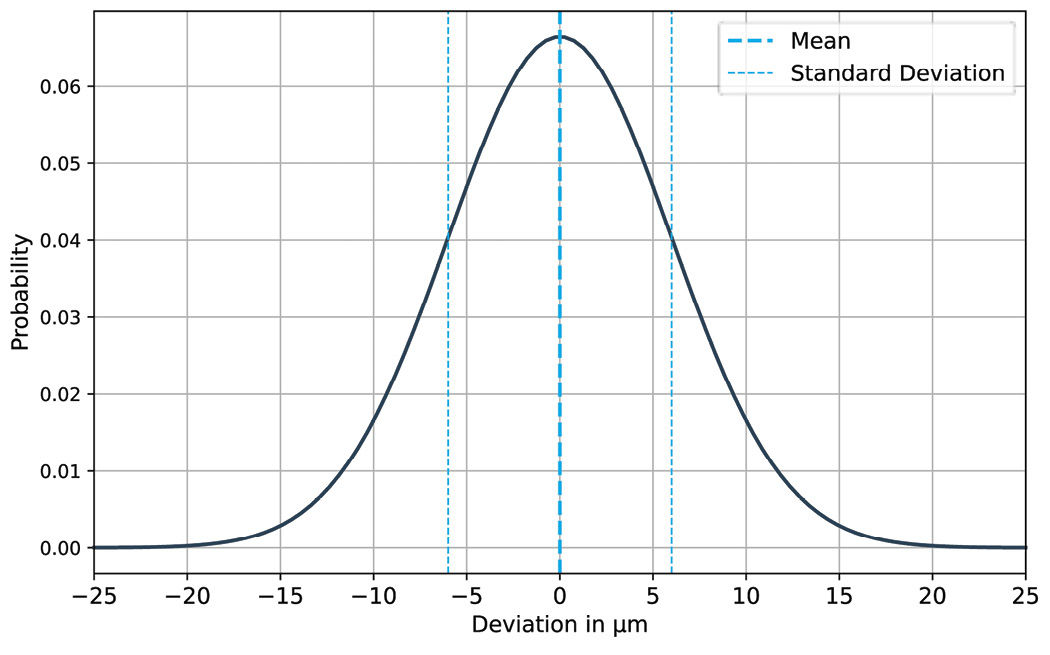
It is assumed that a standard deviation for the position of σ = 6 µm can be achieved in the production process. Figure 1 shows the resulting Gaussian distribution.
To keep the evaluation of the results manageable, it is assumed in this study that no angular errors occur in the manufacturing process.
Statistical Methodology
To determine the influence of the pin positions, 10,000 positions are simulated in a Monte Carlo simulation. In each simulation run, all planetary pins receive a new deviation, which is determined randomly. These deviations are determined in both the radial and tangential directions according to the assumed distribution from Figure 1, resulting in a superposition of two distribution functions.
[advertisement]
Figure 1—Gaussian distribution showing the probable deviations of the planet pin.
The acting torques, load distributions, and deformations are determined for each deviation. A load capacity analysis is then performed in accordance with ISO 6336. However, the load capacity of each planet is used with the resulting force factors.
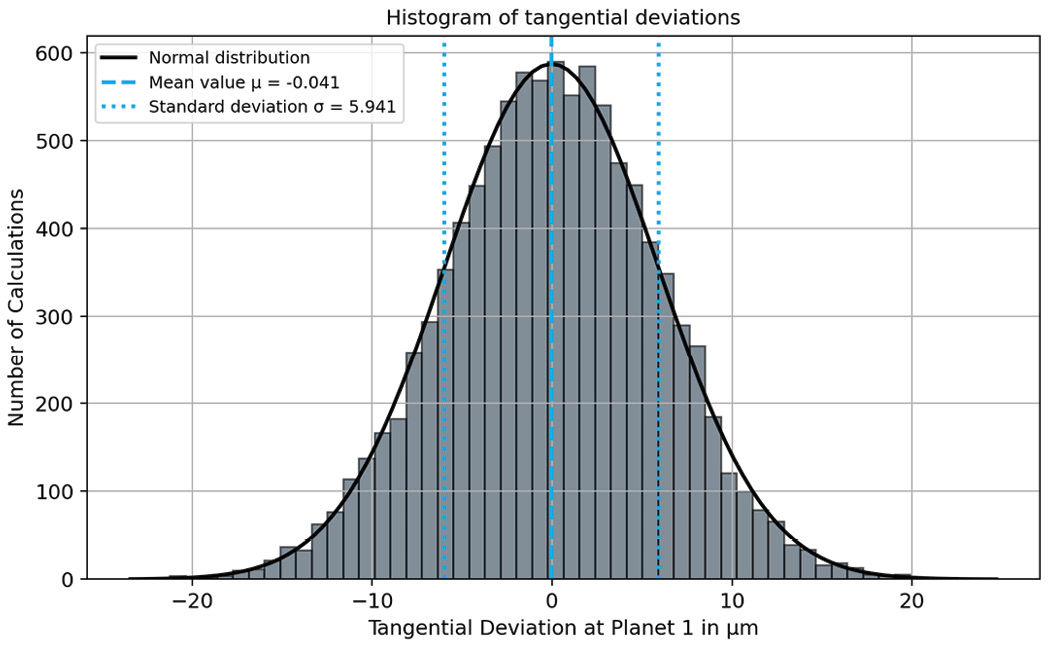
The convergence of the Monte Carlo simulation is assessed visually. Figure 2 shows an example of the tangential deviations for the first planet, variant 1 from the Results and Discussion section, in a histogram. The x-axis shows how far the planet deviates from its nominal position, while the bars show how often each of these deviations appears in the calculation. The mean value and the estimated standard deviation are also shown as vertical lines. A comparison of the histogram with the specified standard deviation shows that both the mean and the standard deviation of the two curves match. The mean value of the data set results in μ = - 0.041 µm and the standard deviation is estimated as σ = 5.941. Thus, we can assume that the results of the Monte Carlo simulation are reliable.
Figure 2—Histogram of the displacement variables for planet 1 of variant 1.
Results and Discussion
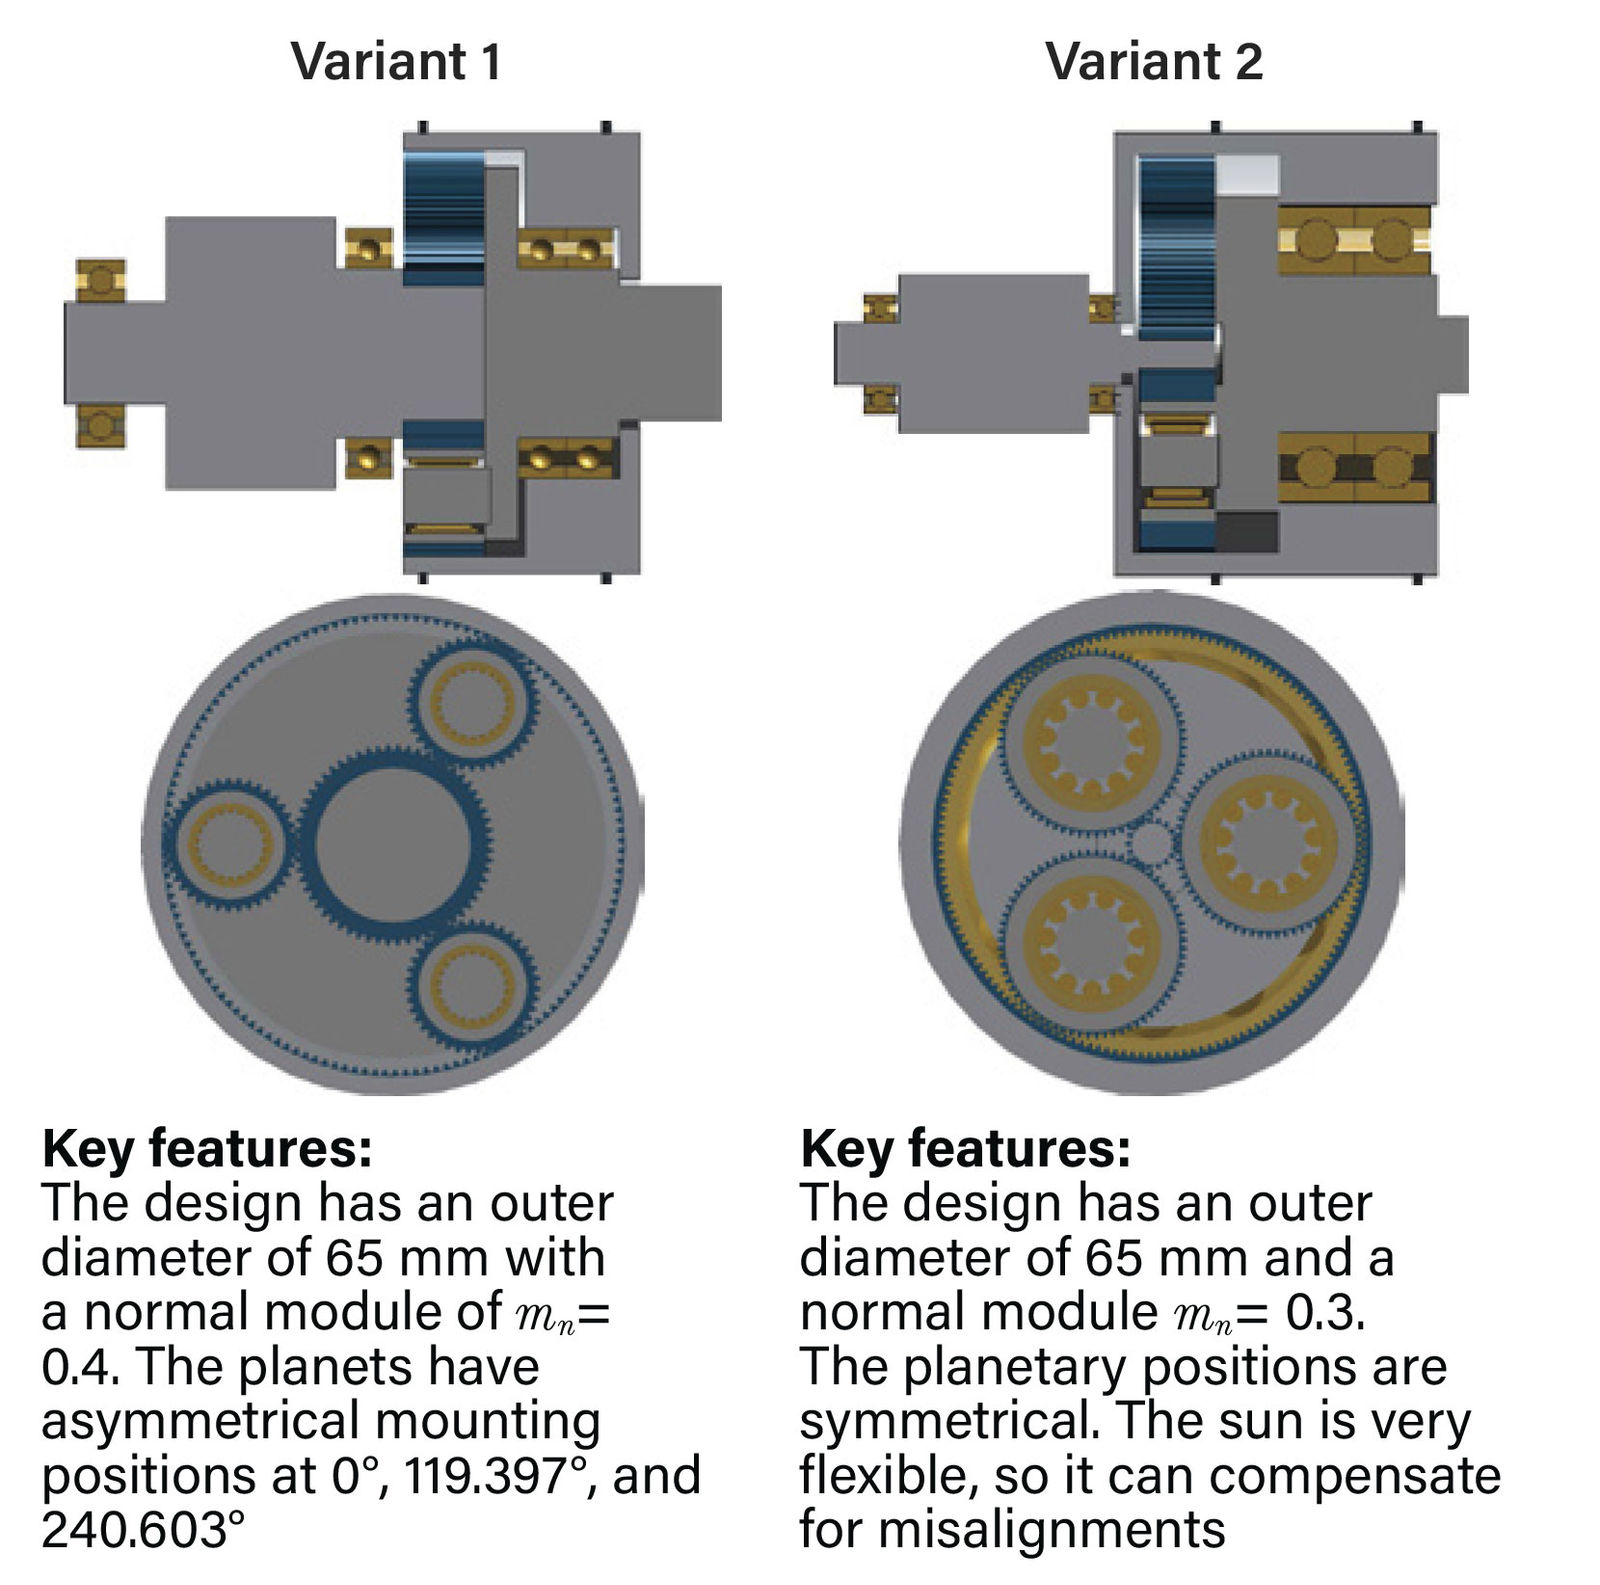
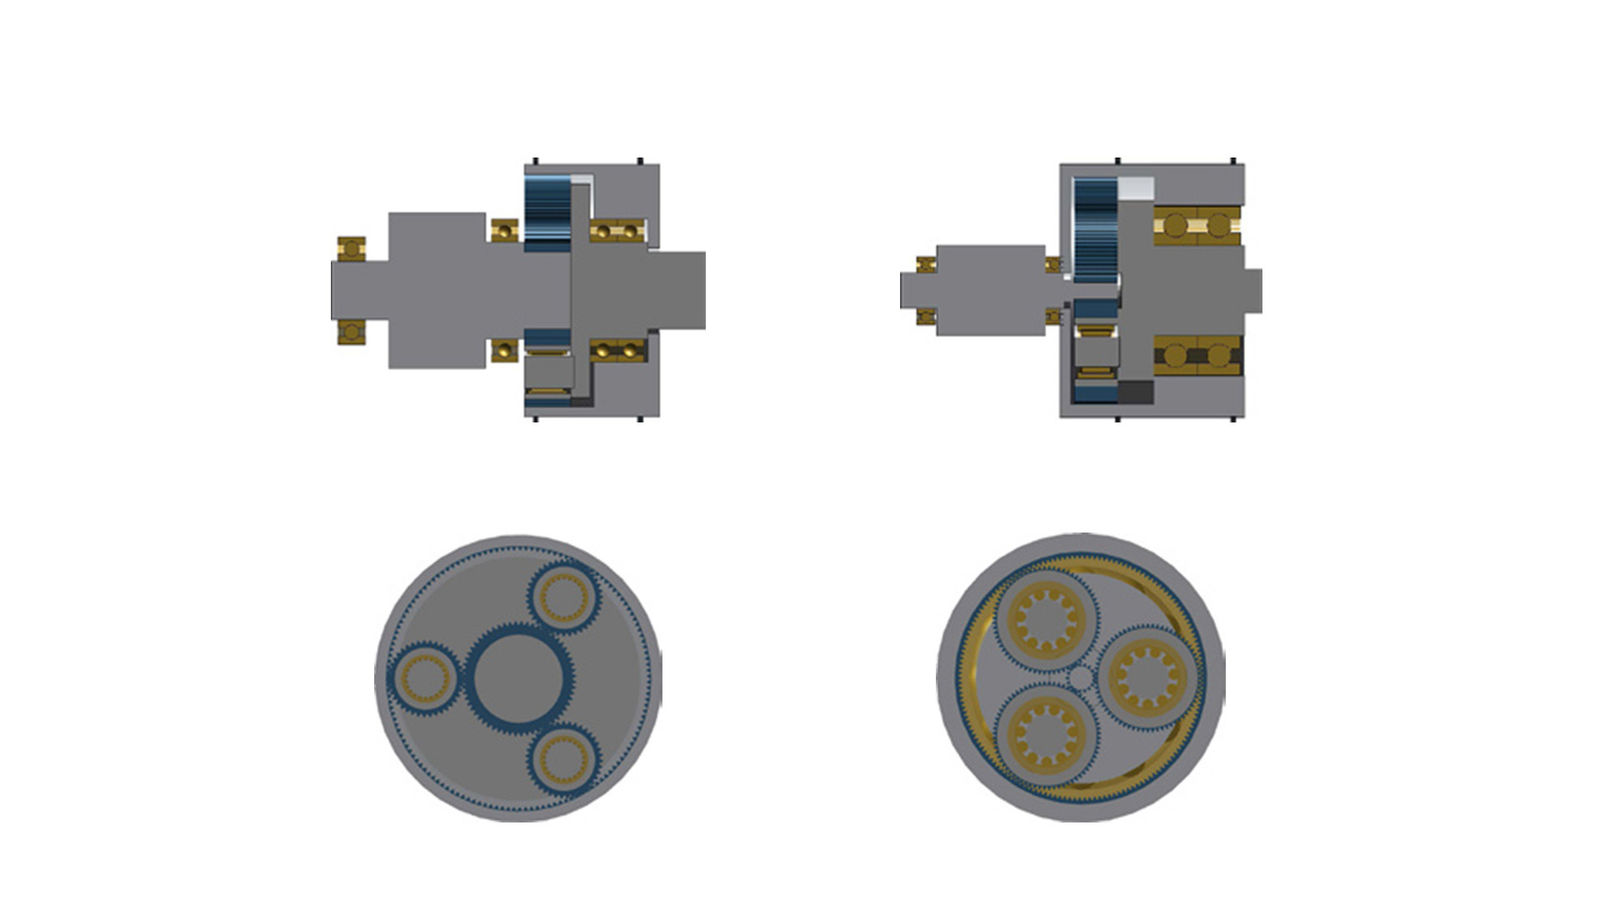
Load differences between the planets can be compensated by a centering movement of the sun, especially in gearboxes with three planets. The centering movement is made possible by the bending of the shaft. To consider this effect, two variants are examined in this paper. The first variant is characterized by small planets and a large, immobile sun. Thus, there is very little compensation by the sun shaft. The second variant is designed with a very high gear ratio and therefore includes comparatively large planets with a smaller sun. This reduces the bending stiffness, which makes it possible for the sun to compensate for deviations effectively. The gearbox models examined are based on classic industrial gearboxes, as offered by many manufacturers. The same balancing effect could also be achieved using a floating ring gear. This variant should not be considered in the following.
Figure 3—Visualization of the variants discussed.
Results for Variant 1
Variant 1 is driven by the sun with 20 Nm at 5000 rpm, with a transmission ratio of i=3.3. This results in a pitting safety of SH = 1.22 and a tooth root safety of SF= 1.77 for the sun-planet mesh according to ISO 6336. These safety factors have been determined using the highest face load factor KHΒ and the worst load-sharing factor Kγ. The planet-ring gear mesh has a flank safety of SH= 2.4; however, this is not critical and is not considered further below.
The safety factors for all Monte Carlo simulation calculations are shown in Figure 4 and Figure 5.
Figure 4—Histogram representation of the flank safety factors.
Figure 4 shows all the calculated safety factors. On average, the nominal safety factor is achieved. The fit with the normal distribution is not perfect. This might indicate that it could be a superposition of multiple distribution functions.
The minimum safety factors in Figure 5 are generally lower, with an average of SH = 1.17. Furthermore, the distribution function has changed from a normal distribution to a Weibull distribution. This is reasonable, as the deviation-free safety factors limit the minimum upper safety factors. Larger deviations can also lead to lower safety factors.
Figure 5—Histogram representation of the minimum flank safety factors.
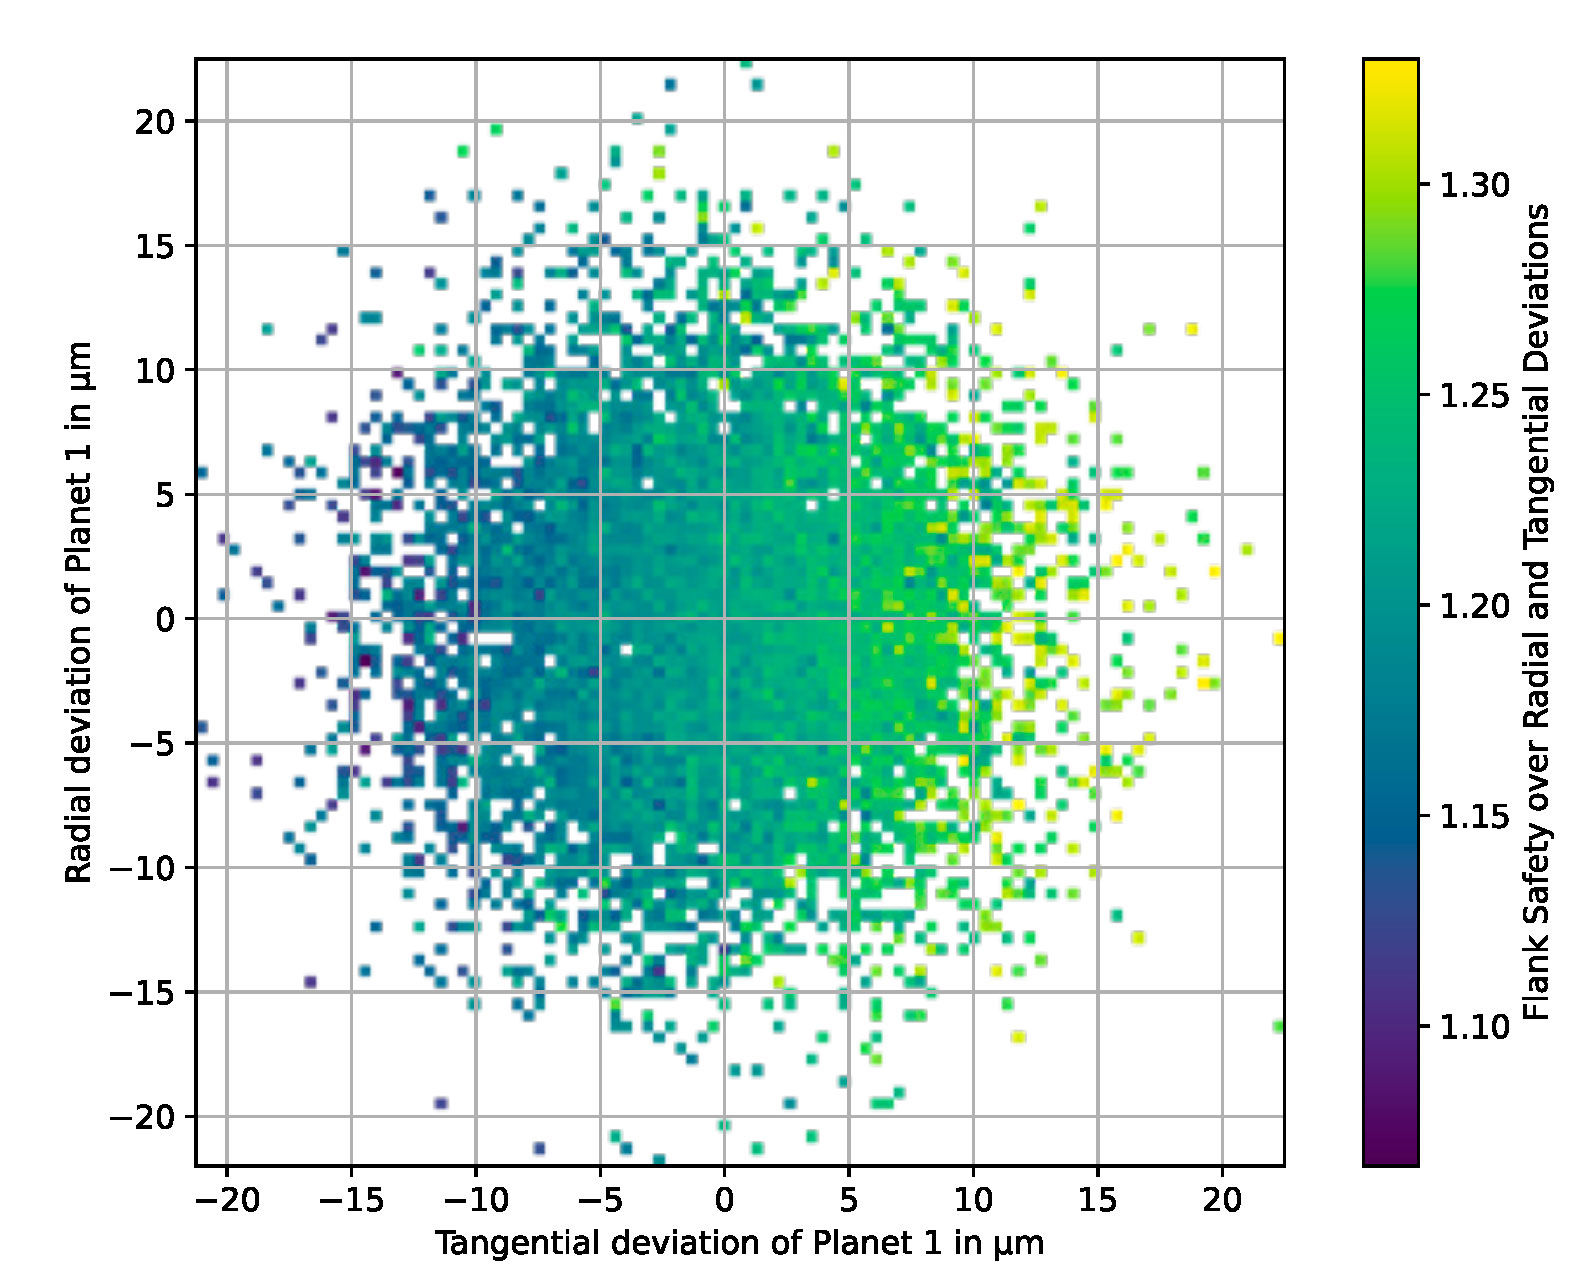
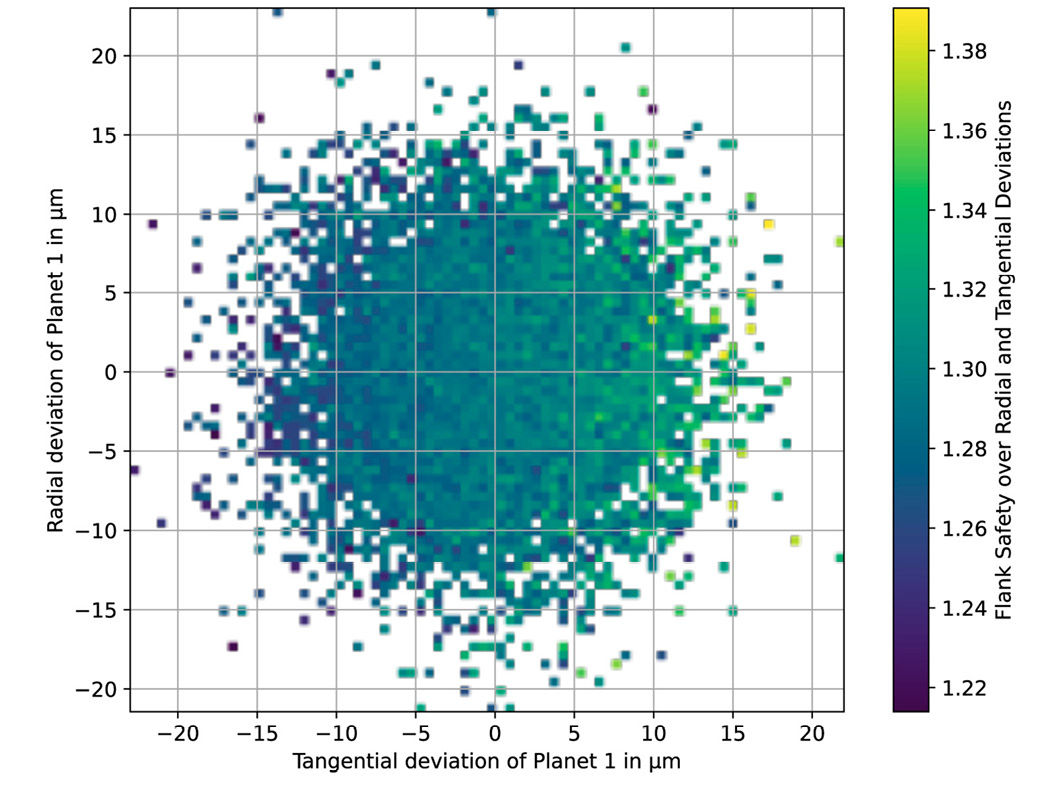
To better understand the effects of the displacements, the displacements relative to a planet are examined in more detail below. Figure 6 shows the safety factors for the sun-planet mesh of planet 1 over the radial and tangential displacements. The flank safety increases as the tangential displacement increases. The highest safety is observed at the right edge, i.e., with a counterclockwise displacement. Radial displacements have no significant effect on the flank safety.
Figure 6—Flank safety factor over the radial and tangential displacements.
What is notable in Figure 6 and all the following diagrams is that there is no continuous color gradient, meaning that individual fields of low safety can appear in areas with higher safety factors. This is because all of the planets were varied, and the safety is determined based on the position of all planets and the resulting load sharing. This effect was reduced by averaging the values in fields with more than one calculation.
To better characterize the system, the next step is to plot the safety factors over the angles. Since this design has three planets, all distances can be represented by two angles. The left side of Figure 7 shows the safety of planet 1 over the angles to planet 2 and planet 3. It can be observed that high levels of safety are achieved when planet 2 and planet 3 are shifted into the load. Safety always increases when the other planets carry more of the load. However, these observations are not appropriate for optimizations.
Figure 7—Pitting safety of planet 1 over the angles to the neighboring planets (left), minimum pitting safety of all planets over the angles to the neighboring planets (right).
The minimum safety factors are shown on the right-hand side. Here, it can be seen that the safety factors reach their maximum closest to the deviation-free nominal design case. The high safety factors are also arranged along an angle bisector, which represents the case where the positions are rotated in the same direction.
The next step is to make a determination on the load-bearing capacity of the overall system based on the data. To do so, the determined safety factors are divided into classes and the largest difference to the tangential deviation between two planets and the classes is determined. This results in a linear relationship between the deviation and the minimum safety factor, as shown in Figure 8.
Figure 8—Regression of the maximum tangential deviation over the minimum pitting safety factor.
The coefficient of determination R2 is 0.9, which indicates that there is a good correlation between the safety factors and the deviations. The deviations primarily occur on the upward side toward the safety factor. The data points are very close to the regression line on the lower side with less safety. Therefore, this regression can be used as a surrogate model, i.e., as a simplified model approach. However, the coefficient of determination of R2 = 0.9 indicates that not all influences are fully represented. This is logical, as a radial displacement can also lead to an additional misalignment as well as the increasing loads on the planet.
Results for Variant 2
10,000 calculations were also performed for variant 2. The mean value of the calculations is -0.082 µm with a standard deviation of σ= 6.045 µm. Concerning these values in Figure 9, we can assume a convergence of the simulation.
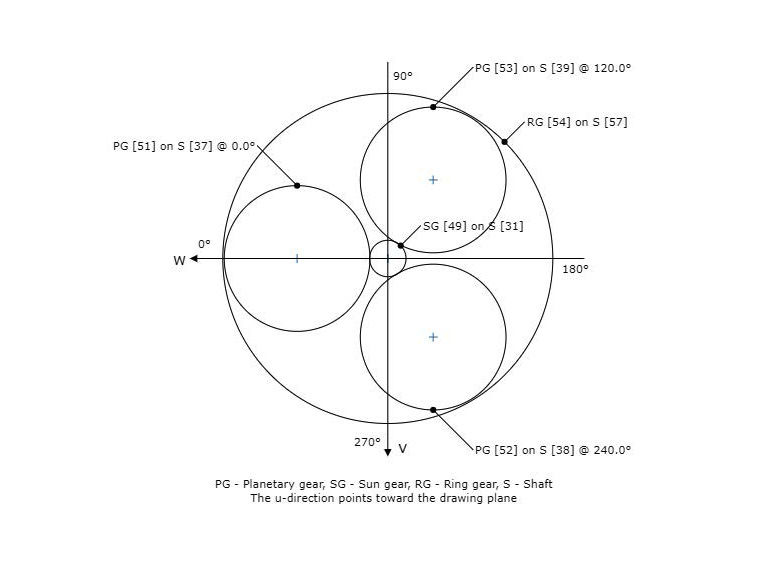
Figure 9—Representation and numbering of the planet positions.
The sun is very mobile in this design, and the thin design makes it possible for the sun gear to compensate for planetary displacements. The mobility is due to the arrangement of the planets being symmetrical. The designation of the planets and the angular arrangement are shown in Figure 9.
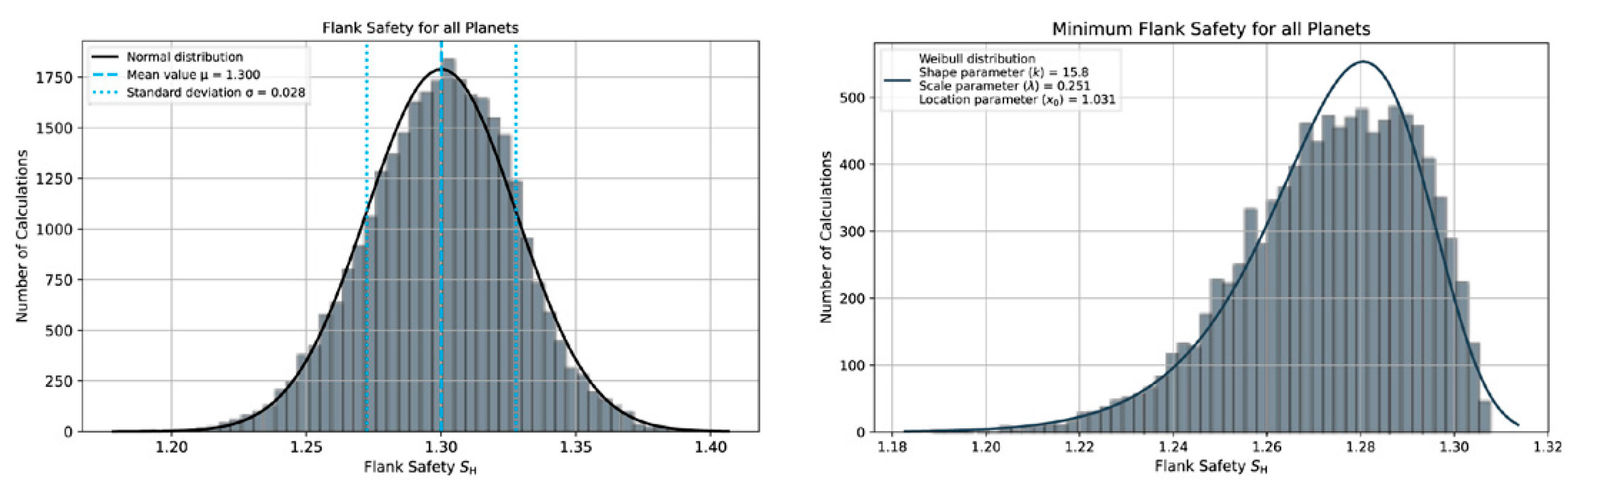
As in the previous model, this gearbox was designed for flank safety in the sun-planet mesh with a nominal safety of 1.2. Figure 10 shows the histograms of the calculations, with the minimum safety factors on the right and all planetary safety factors on the left. Overall, the safety factors for this model are slightly higher than in the previous model. This is because the design calculation is based on the conservative assumption that the highest load-sharing factor Kγ and the highest width load factor KHΒ occur on one planet.
Figure 10—Histograms of the flank safety for all planets (left) and the minimum flank safety for all planets (right).
In comparison with the previous gearbox, the Gaussian curve fits very well here as a distribution function. The minimum safety factors are also represented by the Weibull distribution. However, the fit towards the maximum of the Weibull distribution is lacking, which suggests that it is not one single distribution but a superposition of distribution functions.
The flank safety of planet 1 over the radial and tangential displacements of the planet is shown in Figure 11. On the left side, the displacements are shown in a scatter plot. This plot shows a more uniform safety factor over the entire displacement field (left), compared with variant 1. This suggests that the additional mobility of the sun gear shaft means that displacements have less of an impact on the safety factor.
Figure 11—Flank Safety over radial and tangential deviations(left) and influence of the sun gear stiffness on the pitting safety factor.
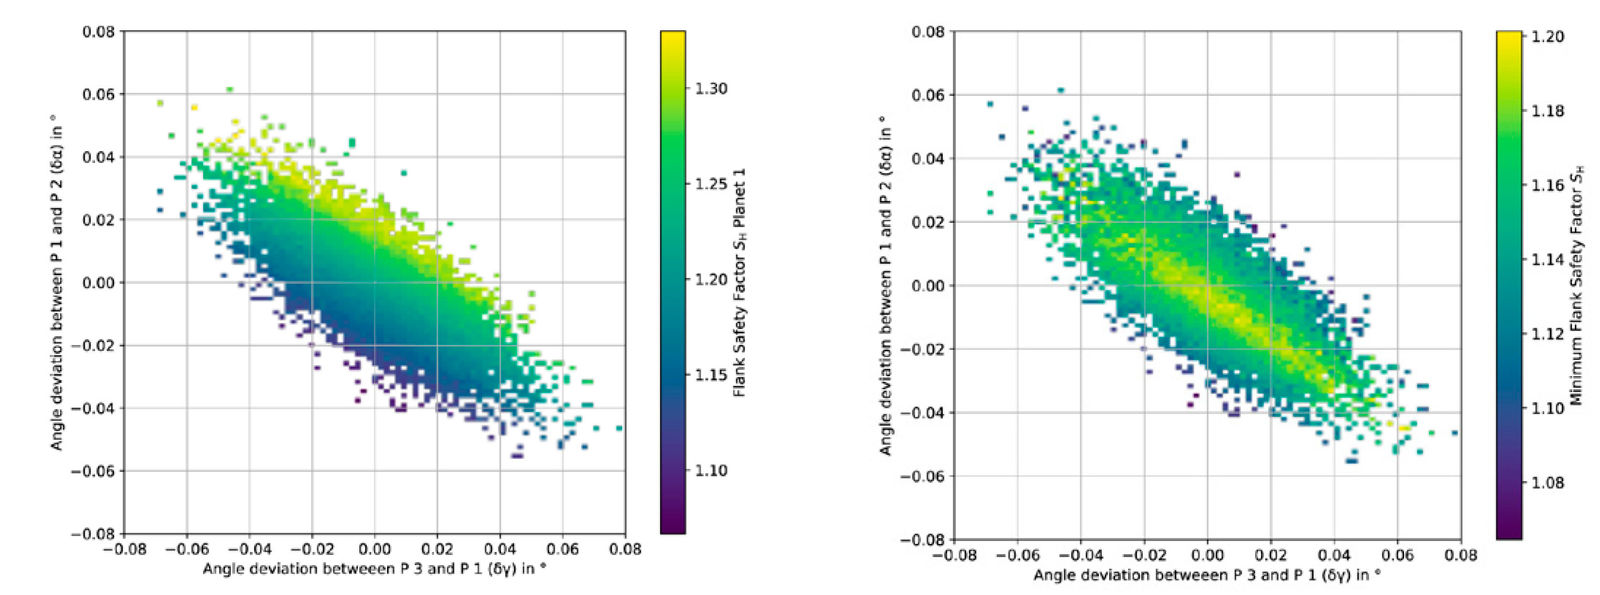
Figure 12 shows the minimum flank safety over the angular deviations between planet 3 and planet 1 (γ) and planet 1 and planet 2 (α). Here a clear difference in the safety factors can be observed. The line of high safety factors that runs diagonally through the diagram is particularly noticeable. Particularly interesting is the comparison with variant 1, where the line of maximum safety factors runs perpendicular to it.
Figure 12—Minimal flank safety over the angles between planet 1–2 and planet 1–3.
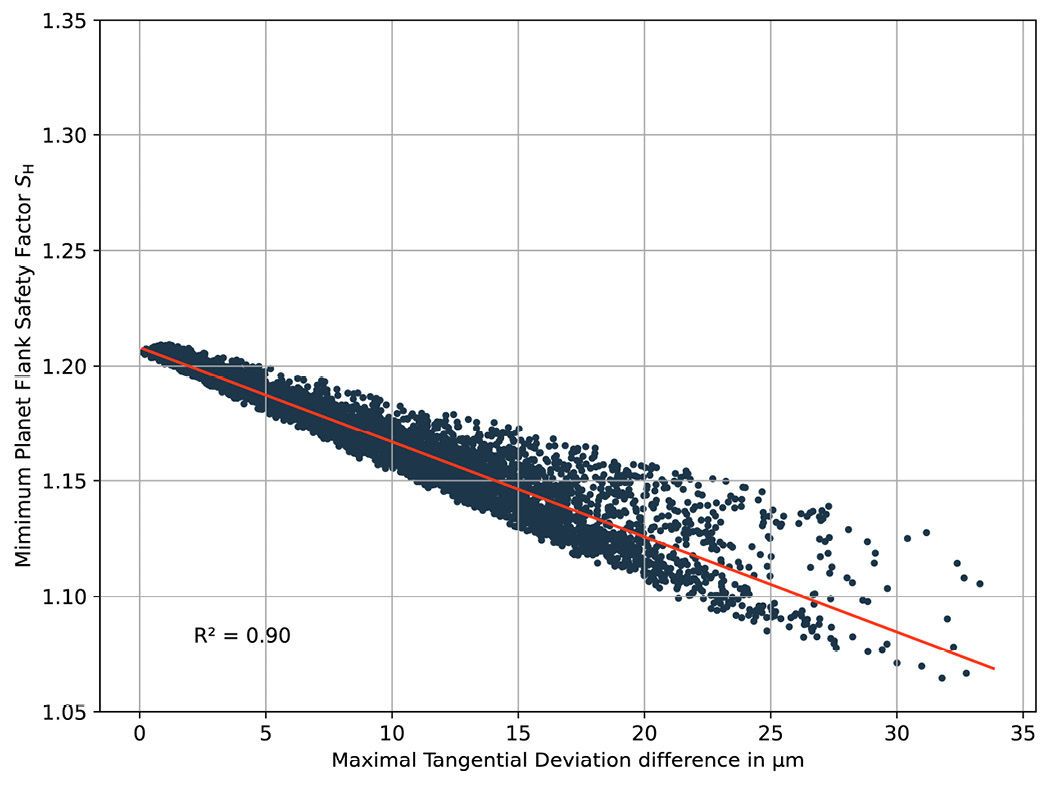
The regression of the results is shown in Figure 13. Unlike in the previous example, the coefficient of determination is given with R2=0.75. Even if the coefficient of determination is worse than in the previous example, this can still be rated as a usable regression considering the initially described specific use case. The wider scatter indicates that the unconsidered influences play a more important role in this case.
Figure 13—Regression of the maximum tangential deviation over the safety factor.
Comparison
Despite their apparent similarity, the variants exhibit markedly different behaviors in the evaluations, which will be discussed in detail below.
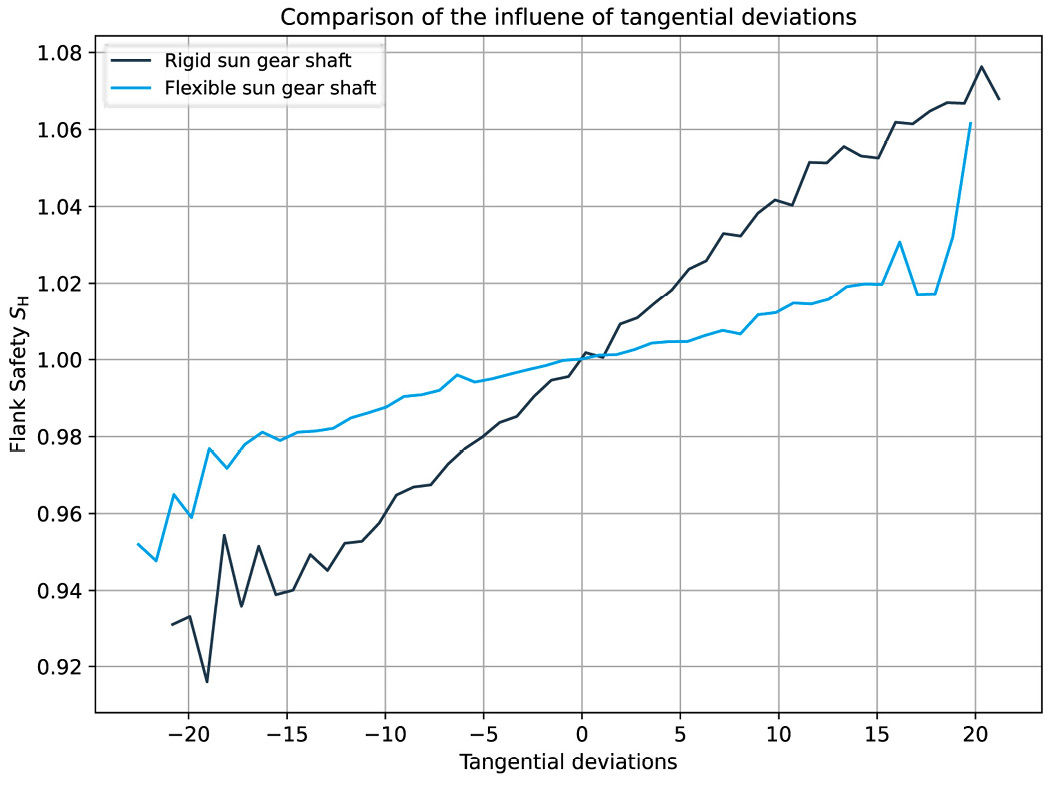
Upon examination of the tangential displacement of the two variants, it becomes evident that tangential displacements exert a comparatively minimal influence on variant 2 displacements This can be demonstrated by comparison of the mean flank safety factor with the tangential displacement as shown in Figure 14. Looking at smaller tangential displacements (<± 15 µm) a linear correlation between the displacement and the safety factor can be observed. For higher tangential displacements less calculation points are available and the noise in the line increases. Moreover, it is evident that the slope of the first variant, which features a stiffer sun shaft, is steeper than that of the variant with a flexible sun shaft.
Figure 14—Comparison of the influence of tangential deviations.
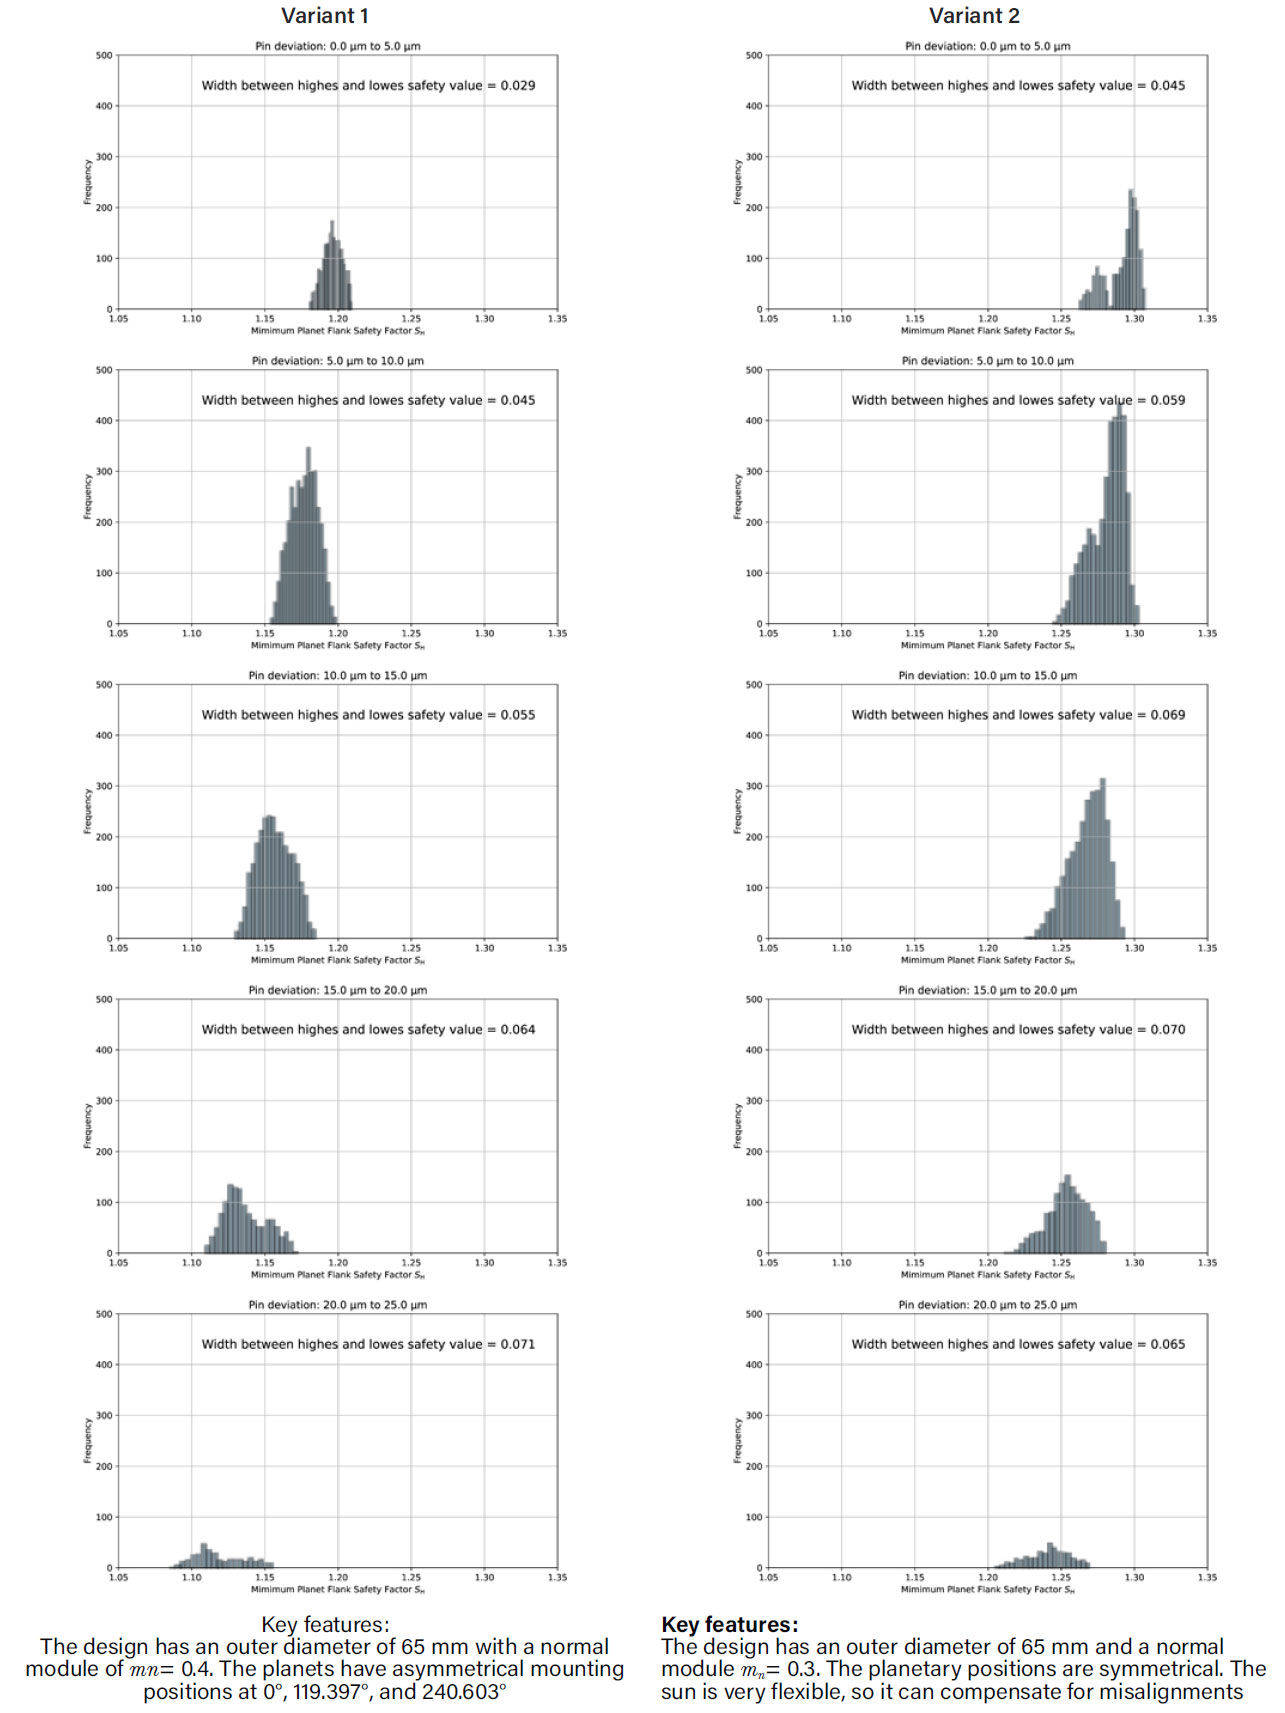
The next step is to compare the minimum safety factors. It is noticeable that the calculations around the regression scatter significantly. To quantify this observation, the distributions of the safety factors for different maximum displacements are analyzed and compared. For this purpose, the maximum tangential deviation is separated into bins of 5 µm. For each bin, a histogram is calculated and displayed in Figure 15. As no distribution function is apparent, a range is defined and output as the distance between the bins with the highest and lowest safety factor.
Figure 15—Comparison of safety factor histograms for different maximum displacements. Power
If the distribution range for the different bins of maximum tangential displacement is plotted in a bar chart, the scatter varies significantly across the bins. The scatter also increases significantly for high displacements in both examples. The scatter of the rigid sun gear shaft is lower here than the scatter with a flexible sun gear shaft. The diagram is displayed in Figure 16. In general, the deviations do not exceed seven percent from the mean safety per bin.
Figure 16—Distribution width for different displacement ranges.
Summary and Future Work
This study presents a method for evaluating systems with tolerances, using an example of a planet carrier to illustrate and statistically evaluate the influence of manufacturing tolerances on the load capacity of planetary gears.
A normal distribution is assumed for the position tolerances at the planet carrier, and the standard deviation of the position tolerance is assumed to be 6 µm. A Monte Carlo simulation with 10,000 calculations is used to analyze the influence of the deviation. For this purpose, the number of simulations was deemed sufficient.
The results show that meaningful conclusions can only be made in an aggregated form. To do so, the minimum flank safeties of the planetary stage are plotted over the angle deviations. The results clearly show that optimal utilization is possible for gearboxes with small deviations. However, planet carriers with significantly larger manufacturing deviations can also be used if the backlash allows. These can be mounted and are functional, albeit with lower maximum torque.
With this realization, a geometric position tolerance can be reformulated as follows: Are the customer’s torque requirements such that the part can still be used despite greater deviations? Or can I find another customer with lower power density requirements in the near future? Based on this approach, large deviations should only be considered as rejects if the storage costs are greater than the profit on the component.
This is a proof-of-concept study in which the positional tolerance of the planet pins on the planet carrier is the only parameter that is varied. The simple study shows how the tolerances can be evaluated. Scaling to larger tolerance systems is possible in principle, but there are still some open questions:
In the abscissa of the regression, all influencing parameters must be represented in such a way that a sufficiently good regression is achieved.
Definition of these parameters may make up the majority of the work.
Since all calculations are independent, adding an additional tolerance should not result in additional simulations. This would provide a very time-efficient method of assessing the tolerances.
Acknowledgment
All results were generated using the scripting module of the FVA-Workbench gear simulation tool and exported to Excel.
References
DIN EN ISO 1101:2017-09, Geometric product specification—Geometric Tolerancing—Tolerance of form, orientation, location and run-out.
ASME-Standard Y14.5, Geometric Dimensioning and Tolerancing.
DIN EN ISO 286-1:2019, Geometrical product specification (GPS)—ISO tolerance system for linear dimensions—Part 1: Principles for tolerances, allowances and fits (ISO 286-1:2010 + Cor 1:2013).
DIN 3964, Center distance dimensions and center position tolerances of housings for spur gearboxes.
ISO 6336-1, Load capacity calculation of spur and helical gears—Part 1: Basic standard, introduction and general influencing factors.
Guyan, J., “Reduction of stiffness and mass matrices,” AIAA Journal, Vol. 3, No. 2; p. 380, (1965): https://doi.org/10.2514/3.2874.
Dipl.-Ing. Benedikt Neubauer, Uwe Weinberger, M.Sc., 2016, LAPLASn, “Calculation of load distribution in gearbox systems with any arrangement of planetary gear stages,” FVA 571 II, issue 1197.
First presented at the 2024 Fall Technical Meeting (FTM), October 7–9, 2024, Rosemont, IL. Printed with permission of the author(s). Statements presented in this paper are those of the author(s) and may not represent the position or opinion of the American Gear Manufacturers Association.


 (1)
(1)