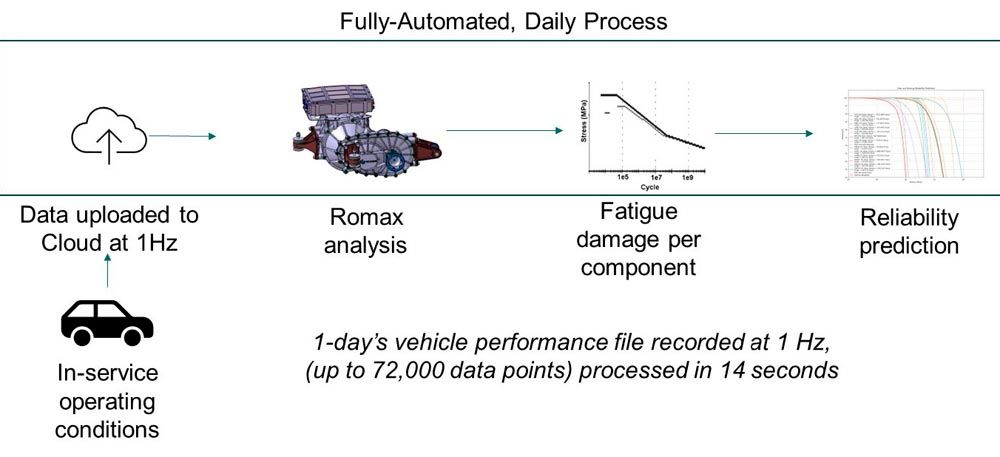
Figure 1—Flow diagram illustrating the processing of CAN data from the vehicle.
Hexagon successfully built the digital twin and as of the end of December 2022, it had successfully processed eight months’ worth of data from 10 different test vehicles, with more being processed each day. The fact of the digital twin’s successful operation is noteworthy. However, of greater interest is what the acquired data has already revealed in terms of how to approach the reliability engineering of gearboxes. This is to be the focus of the rest of the paper.
Predicting Gearbox Reliability
Challenges in Predicting Bearing Reliability
As has been stated, it is possible to calculate the fatigue damage for the gears (contact and bending) according to ISO 6336 and for the bearings according to ISO 16128. 100 percent damage pertains to a 1 percent failure rate for the gears and a 10 percent failure rate for the bearings. The conversion from fatigue damage to reliability for bearings was discussed at length in a paper (Ref. 4) by the same author at the CTI International Congress and Expo in Novi, MI, on 23–25 May 2023.
The paper identifies that the Digital Twin took the most ‘official’ recommendation for the reliability characteristic of the rolling element bearings, i.e., the reliability factor A1 from ISO. Fundamental to this is a Weibull shape parameter (𝛽) of 1.5.
However, the paper also identified that there is substantial reason to question this data, owing to large variations in recommended values of U+1D6FD from different sources. GE (Ref. 5) proposes values that range from 0.7 to 3.5, whilst Bertsche and Lechner (Ref. 6) propose 1.1 to 1.35. Meanwhile, a globally renowned aerospace manufacturer (Ref. 7) claims values as high as 4.0.
The differences in these values are not simply of academic interest—they have a massive impact on the predicted failure rates of gearboxes. With such a wide range of values of U+1D6FD available, the net ends up being cast so wide that pretty much any observed outcome could be said to correlate with one or other of the quoted reliability models.
The CTI paper identified and quantified a key source of variability—that of the duty cycle. A fleet of 10 vehicles was monitored for a period of eight months, with their usage data recorded at a rate of 1 Hz. Without the Digital Twin, these vehicles would have been assumed to have identical usage patterns. Through simulation, the paper was able to quantify the error, i.e., the reduction, in observed Weibull shape parameter that would have occurred if the failure analysis of the fleet was carried out against time and not damage; that is to say, ignoring the duty cycle of each vehicle against including it in the analysis.
The analysis showed that if a value of 𝛽=1.5 is the correct descriptor of bearing reliability, failing to account for the variation in vehicle usage would mean the fleet would appear to fail according to a value of 𝛽=0.67. Even if bearings are, in fact, much more reliable, with a value of 𝛽=4.0, this makes no difference and, again, the fleet would appear to fail according to a value of 𝛽=0.68.
This analysis shows the absolute importance of monitoring the usage of each vehicle if the prediction of component reliability is to make any sense. This was impractical/uneconomic in the past, however, with recent advances in data acquisition, a far more rigorous approach to component reliability analysis now becomes possible. Therefore, our attention should turn to what would be used for gear reliability.
Sources of Data for Gear Reliability
There is a wide range of sources for values on gear reliability, and unfortunately, the picture appears even more confusing than it is for bearings. For a start, different studies (using different data sets) conclude that different reliability models provide the best fit. Some references use the Weibull shape parameter, some use standard deviations in strength, and some use lognormal distributions. Additionally, there is the provision (sometimes applied, sometimes not) of different models for contact and bending, and also for conditions above and below the endurance limit.
Nonetheless, it is useful to see all the different reference data in one place. Much of this has been taken from the Gear Solutions paper by Dr. Hein et al., (Ref. 8) from February 2020, but more have been added from other sources.
Reference (and date) | Contact | Bending |
Gleason (1965) [Ref. 9] | s.d.=23% (inferred from graph of S-N curves) |
Stahl (1999) [Ref. 10] | Limited Life: 𝛽=3.2 | Limited Life: lognormal slog= 0.06–0.13 |
Endurance: s.d.=3.5% | Endurance: 3.4% peened; 6.0% unpeened |
Hofmann (2003) [Ref. 11] | s.d.=3.0% |
Bertsche and Lechner (2004) [Ref. 6] | 𝛽=1.1-1.5 | 𝛽=1.2–2.2 |
AGMA (2004) [Ref. 12] | s.d.=18% (inferred from table of reliability factors) |
GE (2023) [5] | 𝛽=0.5–6.0 |
Table 1—Gear reliability data from a range of published sources.
One clear difficulty in comparing these values comes from the fact that they are presented in different forms. By presenting the values in the form of a Weibull shape parameter, the results directly give a variation in failure against time. By presenting a standard deviation in strength, the source is indicating a normal distribution in strength which indirectly implies a variation in failure against time
Converting Reliability Guidelines into a Common Format and Comparing Them
To make sense of these values, they need to be converted to a “common currency,” and within this study, it was decided to convert to Weibull shape parameter. The approach taken by Hexagon contained several assumptions, and whilst alternative assumptions could have been made, Hexagon does not believe that they would affect the overall outcome of the study.
First, the data for the standard deviation in strength was converted to an equivalent Weibull shape parameter. A graphical representation can be seen in Figure 2. The S-N curve from the standards (ISO and AGMA) refers to the 1 percent failure rate. Assuming a normal distribution and using the standard deviation in strength, a distribution in strength can be implied.
A hypothetical population of gears with this distribution in strength was generated numerically, and their resulting failure points were calculated. The limited life part of the S-N curve for contact for case-carburized gears was used. This was because case carburized gears are most common, contact failures are more common than bending failures and the greatest number of gear fatigue tests have focused on this part of the S-N curve, owing to the greater ease in achieving failures.
Figure 3 shows the data arising from the FZG data for the full set of data. This shows that a normal distribution in strength, projected onto the time axis using the S-N curve of ISO 6336, does not give a perfect Weibull distribution. This pattern was also seen for all the other values used.
It was decided to concentrate on the earlier sections of the population, since it is unlikely that a complete population of gears would be allowed to fail in service. By concentrating on the first 50 percent of failures, a closer match to Weibull could be achieved and a clearer value for 𝛽.
At this point, a “sense check” can be made. Given a standard deviation of 3.5 percent of the mean and 2.326 standard deviations between the mean (50 percent failure) and 1 percent failure, this means that the mean strength of the population (and hence the gear that provides the point that crosses the 50 percent point on the y axis) is 8.14 percent higher than the strength of the gear that sits at y=1 percent. Using the slope of the S-N curve for contact from ISO (13.22) this indicates that the mean life should be approximately 3.0 times the life for 1 percent. Inspection of the graph indicates that the results (5.5e6 cycles for 1 percent; 1.6e7 cycles for 50 percent) match what is expected.
The corresponding analysis using the data from AGMA (Ref. 12) and Gleason (Ref. 9) can be seen in Figure 5 and Figure 6 respectively.
Thus, we can take Table 2 and complete it with values that allow comparison on a like-for-like basis, at least for Contact.
Reference(and date) | Value of 𝛽 for Contact |
Gleason (1965) [Ref. 9] | 0.85 |
Stahl (1999)[Ref. 10] | Limited Life=3.2 |
Endurance=4.95 |
Hofmann (2003) [Ref. 11] | 5.7 |
Bertsche and Lechner (2004) [Ref. 6] | 1.1–1.5 |
AGMA (2004) [Ref. 12] | 1.06 |
GE (2023)[Ref. 5] | 0.5–6.0 |
Table 2—Gear reliability data from a range of published sources, converted to equivalent Weibull shape parameters (b), for contact.
Understanding the Varying Guidelines in Gear Reliability
So, we end up with a wide range of different values for 𝛽, starting with 0.85 for Gleason (Ref. 9), 1.06 for AGMA (Ref. 12), 1.1 from Bertsche and Lechner (Ref. 6), extending up to 4.9 from Stahl (Ref. 10) and as high as 6.0 from GE (Ref. 5). This is an extraordinary range. It is not just an aspect of “academic interest”—if a design engineer has a system for which the reliability needs to be calculated, the biggest impact on the result will not be the use of AGMA or ISO, or the method for calculating misalignment, or how KHBeta is calculated; The single main determining factor affecting the reliability result becomes which data a given engineer choses in order to extrapolate from the predicted life for the 1 percent failure rate to the predicted reliability of the population.
This can be illustrated in Figure 7, where the same nominal life for 1 percent is used and the reliability of the population is predicted using the various values of 𝛽 derived from the various public sources. The problem with the lower values of 𝛽 is clear—there is an enormous variation across the population. For the FZG data, the 80 percent failure point (20 percent reliability) is only ~3 times the 1 percent failure point, but for AGMA it is ~120 times, and for Gleason it is ~400 times.
Consider the implications of using the AGMA and Gleason data. If the purpose of the calculation is to predict when a gear will fail, the result becomes so uncertain that realistically no insight is possible, and the calculation is essentially meaningless. If the purpose is to check observed failure rates against predicted failure rates, the net ends up being cast so wide that pretty much ‘any’ observed outcome could be said to correlate with one or other of the quoted reliability models.
Another problem arises when using some of the data (Ref. 10) in that different behavior is described above and below the endurance limit. This may accurately reflect the results derived from the testing of gears in laboratory conditions, where each gear is subject to constant loading which is targeted to be in either limited life or high cycle regimes. However, if a gear is subject to in-service loading that includes both high cycle and limited life regimes, how is this to be considered? What happens if we have a mix of 80 percent/20 percent, 20 percent/80 percent, 60 percent/40 percent? If we have a loading that is just above the endurance limit for 1 percent of the population, do we assume it to be below the endurance limit (and this requires a different reliability model) for the remaining 99 percent of the population?
The result of this wide variation in results (and the subsequent uncertainty regarding differing behavior above and below the endurance limit) means that engineers tend to take the relatively comfortable approach of predicting “indicative” reliability, saying something “is as durable/reliable as the last design we did.” However, if this is the case then CAE in general is profoundly guilty of what could be described as “over-promising and under-delivering.” The promise has always been that product performance can be predicted so that failure modes can be understood, and “quantified trade-offs” carried out with confidence. In the case of gear reliability, these trade-offs would include:
- How will my failure rate increase (Δ percent) if I decrease my center distance (Δ mm), thereby saving weight and material?
- What are the chances that the gearbox will fail if I run it for another 1,000 hours?
Instead, design engineers tend to approach these considerations more in the form of:
- If we go below center distance “X” we will exceed the safety factor that we have typically used for this application
- Whilst some of our gearboxes have continued to be used beyond this point, we do not have enough confidence to know whether this is suitable
This raises two questions:
- Why has this happened?
- What should we do about it?
How Did This Variability Arise?
By reflecting on its work with different companies and research organizations over the last 30 years in different industries, Hexagon believes there are two reasons for this range of values, and that understanding these can help indicate what the best solution is moving forward.
The first thing to recognize is that, to a certain extent, variability has dropped (and values of 𝛽 have improved) over time. The Gleason data (Ref. 9) is from 1965 whereas the higher values are more recent. It is to be expected that over time the cleanliness of steels and the quality control of the manufacturing processes (heat treatment, grit blasting, shot peening, etc.) has improved, leading to a reduction in the variability of the strength as well as an improvement in overall strength. Certain academics have also suggested this as an observation (Ref. 11).
The other aspect is to look at where these values were derived from. In some instances (Refs. 10, 11), the data comes from test programs from university laboratories, where carefully designed test rigs with high levels of stiffness and alignment are used to test gears that are carefully manufactured and inspected, using consistent and carefully monitored loads. The cycles to failure of each gear would have been carefully recorded. Therefore, the variability of the gear lives could be put down to variations in the material properties alone.
In other instances (Refs. 5, 6), the values would have been based on observations from in-service gears. In these instances, many more factors affect gear reliability which is unlikely to have been measured.
Housing stiffness has been known to affect gear misalignment and hence gear stress for many years (Ref. 3), however, such studies may well not have been able to account for this factor, and in any case production gearbox housings are subject to variations in wall thickness and this will not have been accounted for.
Gear microgeometry is known to affect gear stress and hence durability, and most design engineers account for this by using the nominal (target) microgeometry for their prediction of gear durability. However, variations from the nominal exist, and while it is possible to measure gear geometry and import the actual tooth profile for use in the stress calculation (Ref. 13), it is reasonable to assume that these influences were also not included.
Thus, we see that whilst the values arising from university laboratories account for the variation in gear material strength alone, other values account for a much wider set of variables, factors that are known to affect gear durability but are unlikely to have been known for any given failed gear. These include:
- Gear microgeometry variations
- Gear misalignment variations, owing to variations in housing stiffness and gear alignment tolerances
- Variations in loading
- Potential for inconsistent lubrication, lubricant degradation, water ingress, etc.
During the execution of this digital twin work, Hexagon was able to acquire usage data from many vehicles that were subject to nominally identical operating environments. A study (Ref. 4) was carried out, focusing on bearings (bearings were chosen because these were found to be the components most likely to fail) to account for the impact of not knowing the loading conditions if the Weibull analysis were to be performed to determine the reliability of bearings.
This study showed that, no matter how high the actual value of 𝛽 is for the bearings (i.e., a predictable failure), if the failure analysis is carried out against time and not damage, the study would deduce a much lower value of 𝛽 (i.e., an unpredictable failure). This shows how the failure to include in analysis factors that substantially affect a component/system can lead to the incorrect conclusion that the component/system’s reliability is profoundly unpredictable.
Figure 8 gives a graphical representation of what Hexagon believes is happening for gears, and where the variation in values of 𝛽 comes from. Variability in material strength alone may well correspond to a 𝛽 of ~5.0, and a quite “peaky” distribution in reliability, but when unknown factors are included, this distribution gets flattened, so that when many significant factors are left unaccounted for, the observer is left with what appears to be a profoundly unpredictable system.
In this situation, it is unsurprising that design engineers will err on the side of caution, basing new designs on old design practices rather than seeking optimum designs with full confidence in quantifiable trade-offs.
How Should This Data Be Used?
This insight indicates how to move forward with future developments. Reliability predictions must start somewhere, and the best indication is that the variability indicated by the university studies (Refs. 10, 11) properly identify the variability of strength of modern gear materials. This gives an “upper limit” on the predictability of in-service applications since it is not possible for any production gearbox to be as tightly controlled, or to have as much data as a research laboratory, in terms of manufacturing, inspection, assembly, and loading.
This paper has shown how various influences that affect the durability of gearboxes push the observed failure rate towards randomness if they are not accounted for, and in effect, this determines what data should be used in the prediction of gearbox reliability. Load spectrum, gear geometry, and gear alignment are all examples of these influences.
Therefore, if any of these factors are known, or are tightly controlled, then there will be less scatter imparted on the life of the gearbox components, and a higher value of 𝛽 can be used. If these factors are not known, or they are poorly controlled, then a lower value of 𝛽 should be used.
Broadly speaking, any prediction of reliability must account for as many of the variables that affect reliability as possible. When working on Failure Mode Avoidance, Tim Davis (Ref. 14) extended the work of Taguchi, Miscke, and Phadke to take signal factors and noise factors into account (see Figure 9). In this instance, there is a danger that if the signal-to-noise ratio decreases, it becomes difficult to achieve the ideal function of the system, and error states occur.
The analogy for gearboxes is clear—the ideal function is reliable operation and component failure is an error state. Hexagon’s digital twin work has shown how vehicle usage can be a noise but with the correct setup can be converted to a signal factor. Put another way, it is converted from an unknown to a known.
Within the framework of this digital twin, Hexagon has sought to convert one major factor (load spectrum) from an unknown to a known, from a noise to a signal factor. In the absence of reasons to the contrary, the digital twin uses the recommendations from Stahl (Ref. 10) from the limited life for all loads, with different models for contact and bending. Furthermore, any Weibull analysis of failed gearboxes should provide decent clarity regarding the behavior of the population as a whole.
On the other hand, if the load spectrum is assumed and not measured, the analysis carried out by Hexagon implies that a very different approach to reliability should be considered, for example, Bertsche and Lechner (Ref. 6). In this case, it is unlikely that a Weibull analysis of failed gearboxes will provide credible insight into the reasons for such failures.
Nonetheless, the digital twin, with the ability to record the load spectrum for every gearbox, provides the framework for the future of reliability engineering of gearboxes. Hexagon is working with a number of companies that are routinely harvesting vehicle usage data from substantial quantities of their vehicles. By feeding this data into best-practice CAE tools, unprecedented accuracy can be achieved in the prediction of component and system reliability.
However, more could be achieved. As it stands, there would still be assumptions that could be improved upon. For example, every OEM has values for the allowable bending and contact stresses of its materials. These values substantially affect any predictions of reliability, yet even though they are affected by a company’s suppliers, machining, heat treatment, and quality control, often the ‘reference’ data from ISO 6336 Part 5 is used.
With the cost of data acquisition plummeting, Hexagon believes we will start to see large-scale data acquisition and failure recording. When combined in a disciplined manner, this would yield unprecedented insight into the durability and reliability of gearbox systems, an insight that could be fed back to engineers for reuse in the design of the next generation of vehicles. Effectively, a “digital thread” as shown in Figure 10, would be complete. This is one of the ambitions of Nexus.
This paper talks about digital twins, but there are other fashionable terms, too. The internet of things (IoT), big data, and AI are often discussed, yet it is not always clear how they will deliver benefits. The proposal for data acquisition, failure recording, and correlation is an example of how such fashionable ideas can be applied in an achievable manner to gearbox engineering to deliver benefits in terms of reduced cost, reduced risk, faster development times, reduced material usage, longer gearbox life, and improved sustainability.
Hexagon does not propose discarding the wealth of knowledge that is encapsulated in standards such as ISO 6336, but rather building upon these standards and refining them based on the evidence provided by the usage and failure patterns identified in each application. Some major OEMs already make changes to the standards for their benefit and based on their data, thereby giving them a commercial advantage. This is set to accelerate massively.
Further comparisons are intriguing. Stahl’s data (Ref. 8) was based on 509 gear tests. Soon, Hexagon’s Digital Twin will be extended to cover more than 10,000 gearboxes, each with more than 10 gears, each one effectively an individual test sample since its usage profile will be monitored throughout its life.
On one hand, Stahl’s data is more useful since it is available today, and all 509 gears are assumed to have failed and contributed to the statistical analysis, whereas the vast majority of the 100,000+ gears under study in the digital twin will not fail. Additionally, even the early failures are not expected for a considerable period.
However, the failure analysis arising from such a digital twin would be focused on a specific application, a specific supply chain, a specific production line with its heat treatment, lubricant selection, etc. Furthermore, over time the number of gearboxes under study will expand another one or two orders of magnitude (perhaps more), and the failure data will start to stack up. When this happens the statistical significance of the data arising from such a process, and hence its validity and accuracy, will start to dwarf that available from the university research programs that have supplied it to date. All of this will deliver a clear benefit to industry, to the users of such vehicles, and to the economy and environment.
Stahl’s data is already 24 years old. Compared to the alternatives, the time to results for the digital twin described here is probably not so onerous.
Conclusion
The term digital twin has often been spoken about, but rarely has it been seen to be put into operation and to deliver value in practice. Likewise, terms such as IoT and big data may have delivered value when tracking people’s browsing habits and targeting advertising, but there has seemed to be little relevance to gearbox engineering.
Recent work by Hexagon shows that this is changing. In collaboration with a world-renowned vehicle manufacturer, it has developed and put into service a cloud-based digital twin for a multispeed gearbox. This digital twin predicts gear and bearing fatigue and reliability, accounting for all the same influences on component fatigue as are included in state-of-the-art design analysis, but in a process that runs automatically, requiring no human interaction or intervention.
In converting from durability (percentage damage, safety factor) to reliability (failure rate), data has been referenced from various sources. However, these different sources have been shown to have widely varying values which, if used in the prediction of gearbox reliability, would lead to huge variations in the results depending on which reference was used.
It has been argued that part of this variation is due to the passage of time, and part of it is due to the difference between research laboratory testing programs and observation from industrial usage patterns. The former tightly controls many of the factors that affect gear life (loading conditions, alignment, etc.) which are either assumed or left unknown in industrial applications.
The key to useful gear reliability predictions is to maximize the signal-to-noise ratio, and in practice, this means measuring as many of the factors that affect gear life as possible. In the past, this has not been practical. However, due to recent developments, we are starting to see large programs of data acquisitions by leading vehicle companies. In the short term, this work will use current reference data on reliability to predict when gearboxes are likely to fail; over time, once proportions of the gearbox population have actually failed, the observed failure rate can be compared with the predicted failure rate and adjustments made.
The future of gear reliability prediction is starting to take shape. Manufacturers will be able to collect precise usage data on tens of thousands, probably millions of gears, and match this against failure data. Even though the failure rates will be small, the number of samples will be statistically significant, and will eventually be orders of magnitude greater than the number of samples that have been used to derive current reference data. Furthermore, each company’s data will be based on its application and production processes, rather than general gear applications. Rather than fresh attempts to rewrite gear analysis methods, these will be minor tweaks to the current gear rating standards but will provide vastly greater confidence in the results.

References
- Grieves, M., 2016, “Origins of the Digital Twin Concept,” DOI: 10.13140/RG.2.2.26367.61609.
- ISO/TS 16281:2008, Rolling bearings—Methods for calculating the modified reference rating life for universally loaded bearings.
- James, B. et al., May 2000, “Predicting the effects of housing flexibility and bearing stiffness on gear misalignment and transmission noise using a fully-coupled non-linear hyperstatic analysis,” C577/005/2000, Proceedings of the Institution of Mechanical Engineers, May 2000.
- James, B. and Long, L., May 2023, “Demonstrating a Cloud-based Gearbox Digital Twin using telematics data for reliability predictions,” CTI USA Symposium, 24–25 May 2023, Novi, MI.
- Distribution Types | Predix APM | GE Digital.
- Bertsche, B. and Lechner, G., 2004, Reliability in Automotive and Mechanical Engineering—Determination of Reliability Levels for Components and Systems (German: “Zuverlässigkeit im Fahrzeug- und Maschinenbau - Ermittlung von Bauteil- und System-Zuverlässigkeiten”), 3rd edition, Springer (publisher), Berlin, Germany.
- Private conversation during technical and commercial discussions.
- Hein, M. et al., “Reliability of Gears: Determination of Statistically Validated Material Strength Numbers,” Gear Solutions, February 2020.
- “The Strength of Bevel and Hypoid Gears,” Gleason, 1965.
- Stahl, K., 1999, “Life-time statistics (final report)—Statistical methods for estimation of the life-time and reliability of components and exemplary application for gears” (German: “Lebensdauerstatistik (Abschlussbericht) – Statistische Methoden zur Beurteilung von Bauteillebensdauer und Zuverlässigkeit und ihre beispielhafte Anwendung auf die Zahnräder”), IGF Nr. 11154, FVA-Nr. 304/I, Issue 580, Research Association for Drive Technology (FVA), Frankfurt/Main, Germany.
- Private conversation with Professor Dieter Hofmann, Newcastle University, circa 2003.
- ANSI/AGMA, 2004, “Fundamental Rating Factors and Calculation Methods for Involute Spur and Helical Gear Teeth,” ANSI/AGMA 2101-D04.
- James, B., Hughes, S., 2022, “Developing a digital thread linking gear design to manufacturing simulation and metrology,” VDI Wissenforum, Munich, 12 September 2022.
- Davis, T., 2004, “Measuring Robustness as a Parameter in a Transfer Function,” SAE 2004-01-1130.


 Power Transmission Engineering is THE magazine of mechanical components. PTE is written for engineers and maintenance pros who specify, purchase and use gears, gear drives, bearings, motors, couplings, clutches, lubrication, seals and all other types of mechanical power transmission and motion control components.