The Scripting Module (Ref. 6) can be used to automate complex processes in the FVA-Workbench. Simple commands can be used to load additional data, run calculations, and create custom output reports. Possible output formats include simple text files, clearly prepared HTML reports or ready-configured Excel files.
For example, the Scripting Module can be used to load previously generated samples and process them in sequence. In this case, a sample describes a possible configuration of deviations as they can occur in reality.
Figure 3 shows the sequence for the statistical tolerance analysis in this example. The calculation is configured in an XML file in which the components and the form and position deviations are defined. The samples are then automatically created based on the input file and the configured sampling strategy (randomly or systematically according to an experimental plan). The input file is processed by a MATLAB script, which saves the geometry data of the individual samples in an Excel file that can be read by the FVA-Workbench. A model file for which the calculations are to be performed is also required as an input.
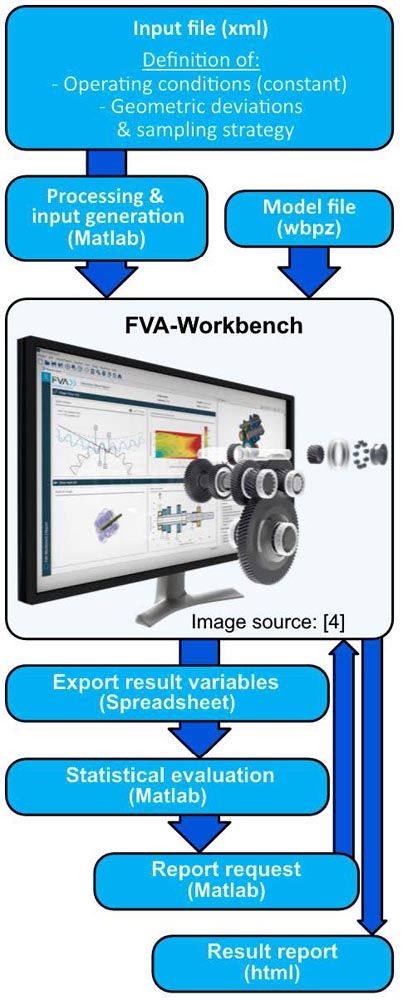 Figure 3—FVA-Workbench statistical tolerance analysis sequence for rolling bearing calculations.
The FVA-Workbench is then started in Batch Mode via a command line call and automatically processes the generated samples and saves the calculation results in an Excel file.
The statistical analysis of the results is then performed using suitable MATLAB scripts. A results report can also be generated for individual samples in the FVA-Workbench. This report is output in HTML format and includes detailed, graphical calculation reports for the individual system components (e.g., shaft bending, flank pressure in tooth meshes, or lifetime).
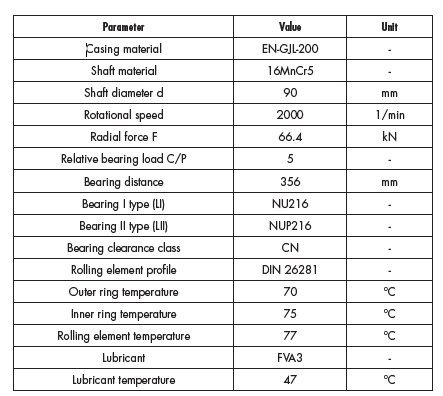 Table 1—Constant calculation parameters.
Calculation Example
The following example will demonstrate the sequence using a simple system consisting of a casing and shaft with a fixed-floating bearing arrangement with a radial force F acting on the center of the shaft (see Figure 4).
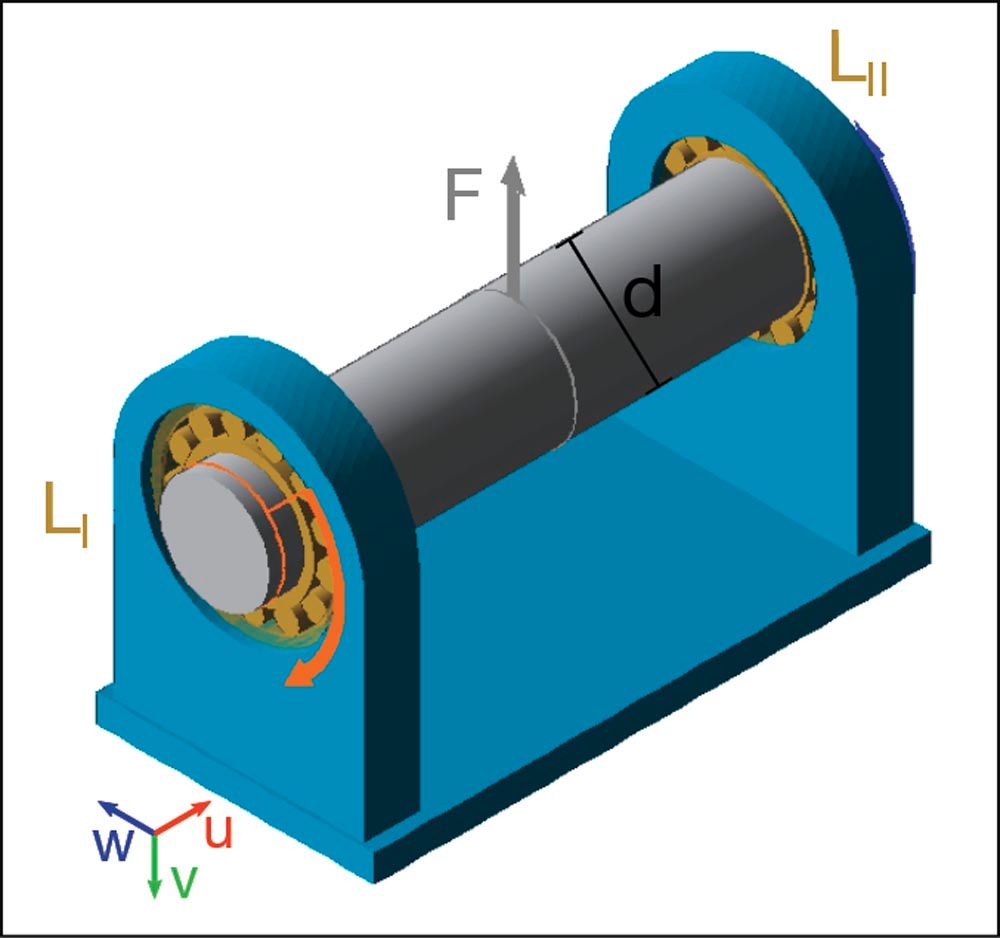 Figure 4—System model for the calculation.
Table 1 above provides an overview of the constant calculation parameters:
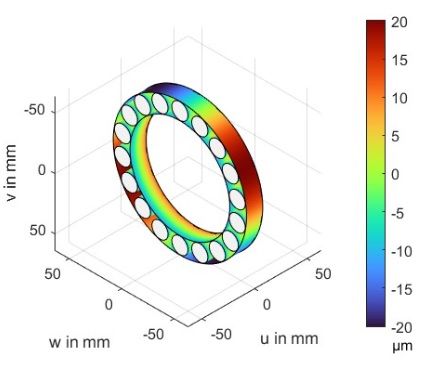
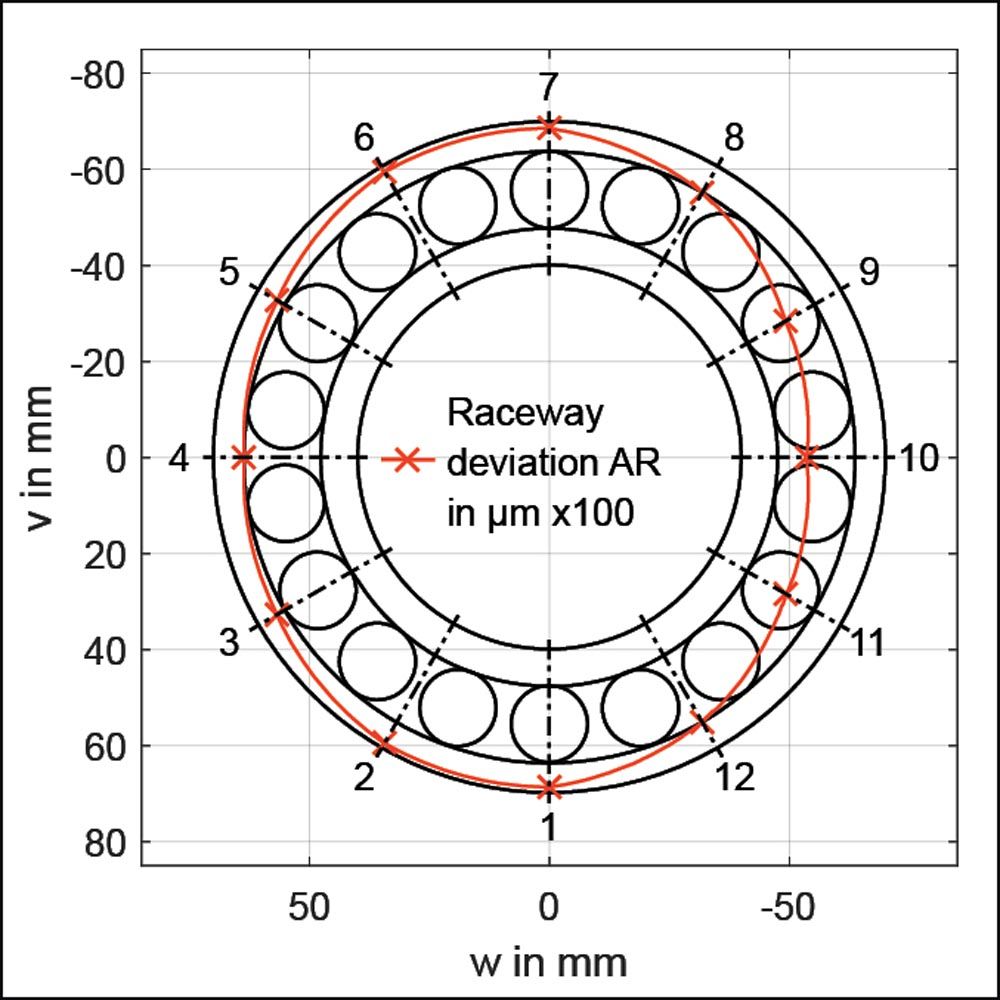
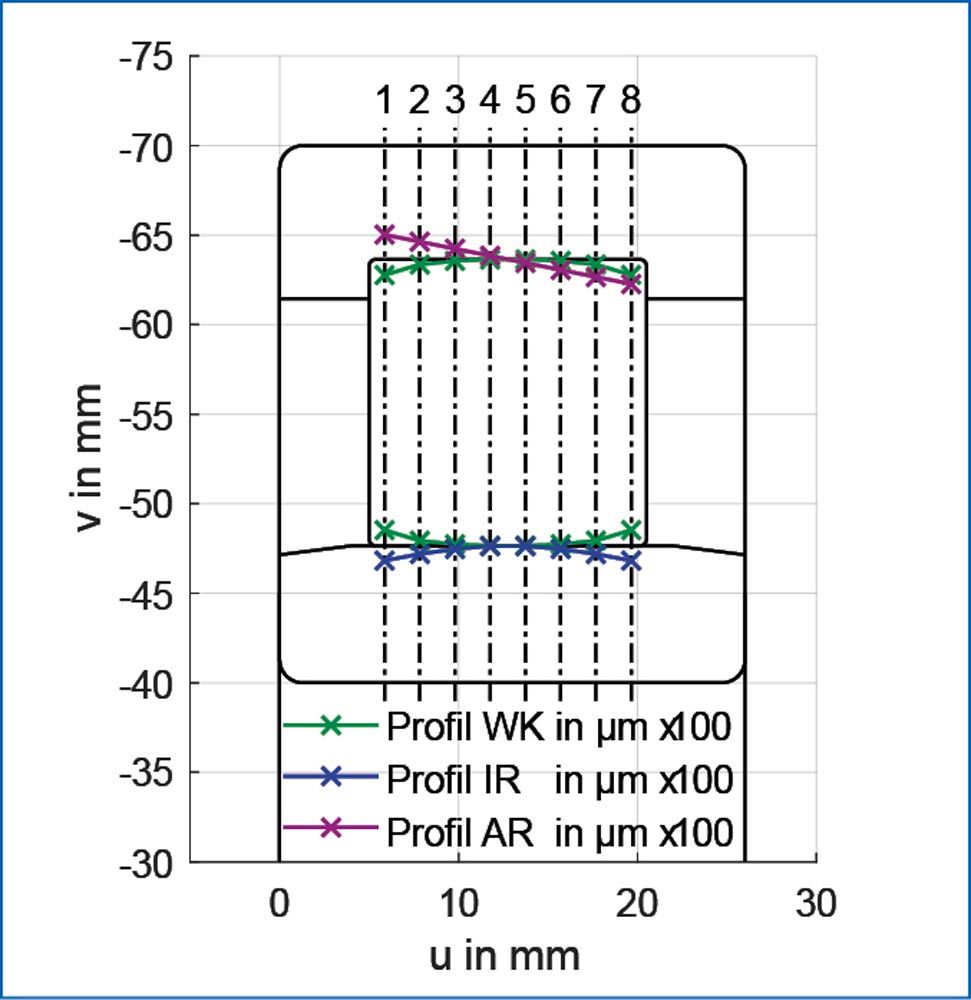
In addition to these constant parameters, a variable ovalization of the outer ring is also specified for Bearing I. The ovalization has an amplitude between 0 µm and 20 µm with a phase angle between 0 degrees and 360 degrees, modeled using a discrete Fourier transformation (DFT). Furthermore, a taper of the inner ring is also simulated with a value range of -5 to 5 angular minutes (').
The ovalization is represented in the FVA-Workbench as a form deviation of the outer ring in the circumferential direction (cf. Figure 1), whereas the taper is represented as an axial form deviation of the inner ring (cf. Figure 2). Furthermore, variation of the bearing clearance within the permissible limits of class CN is considered for both bearings. For bearing types NU216 and NUP216, this corresponds to an interval between 40 µm and 75 µm according to DIN 620-4 (Ref. 7). This is modeled as a change to the diameter of the outer ring, which is added to the ovalization. The concrete values for each individual sample are determined by Latin Hypercube Sampling.
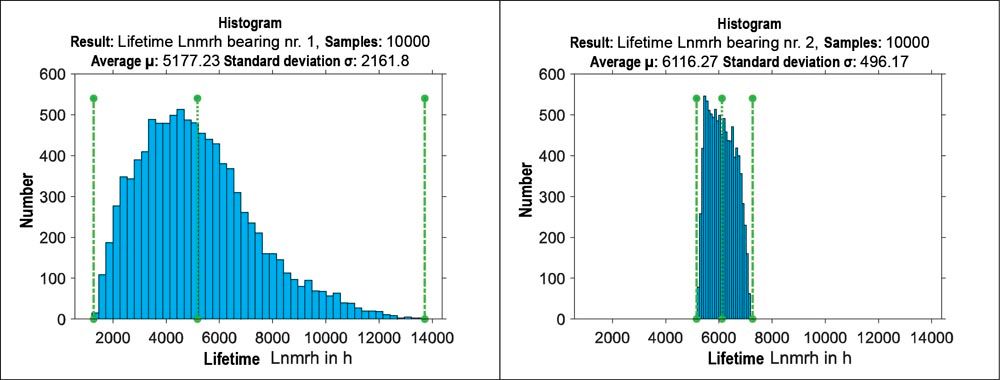 Figure 5—Lifetime Lnmrh histograms for Bearing I (left) and Bearing II (right).
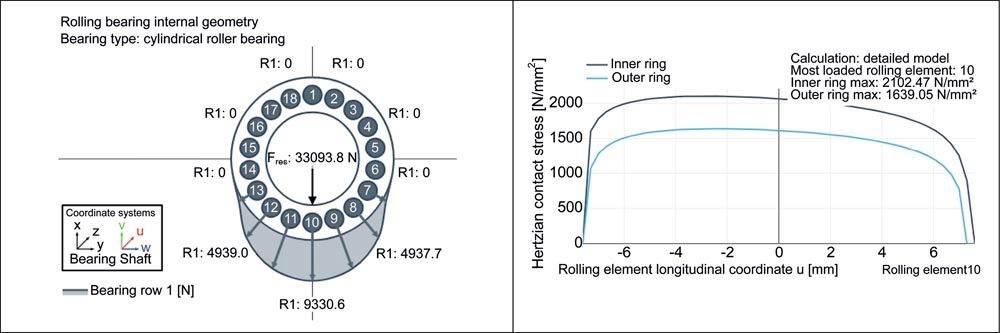 Figure 6—Rolling element load distribution (left) and axial pressure curve at the most heavily loaded rolling element (right) with median lifetime Lnmrh on Bearing II.
A total of 10,000 individual cases are evaluated, with the sampling of the variable values following a Latin Hypercube Design (LHD) with minimized correlation of the variables. This sampling strategy achieves the best possible coverage of the space (Ref. 8). The calculation time is just under 90 minutes on a desktop workstation.
Figure 5 shows the distributions of the resultant modified reference lifetimes in hours (Lnmrh) according to DIN 26281 for both bearings in histogram form. It can be observed that the scatter is much greater for Bearing I than Bearing II. The value range for the lifetime of Bearing I extends beyond that of Bearing II on both sides, meaning that both higher and lower lifetimes can occur than with Bearing II. This is due to the defined geometric deviations on Bearing I, the effects of which will be analyzed in more detail below.
For reference, the internal bearing load distribution on the rolling elements, as well as the axial pressure curves of the most highly loaded rolling element (number 10) for the inner and outer ring contact from the FVA-Workbench report, are shown in Figure 6 for the median value (6096 h) of the lifetime Lnmrh on Bearing II (where only the bearing clearance is varied within the limits of class CN). The deflection and the pressure distribution of the bearings are calculated according to Teutsch & Sauer (Ref. 9). The rolling element load distribution (top) follows the typical arc-shaped curve, whereas the pressures in the axial direction (bottom) increase due to the shaft bending in the negative u-direction. It should be noted that greater Hertzian pressure occurs on the inner ring than on the outer ring due to the deforming contact.
 Min. lifetime bearing I
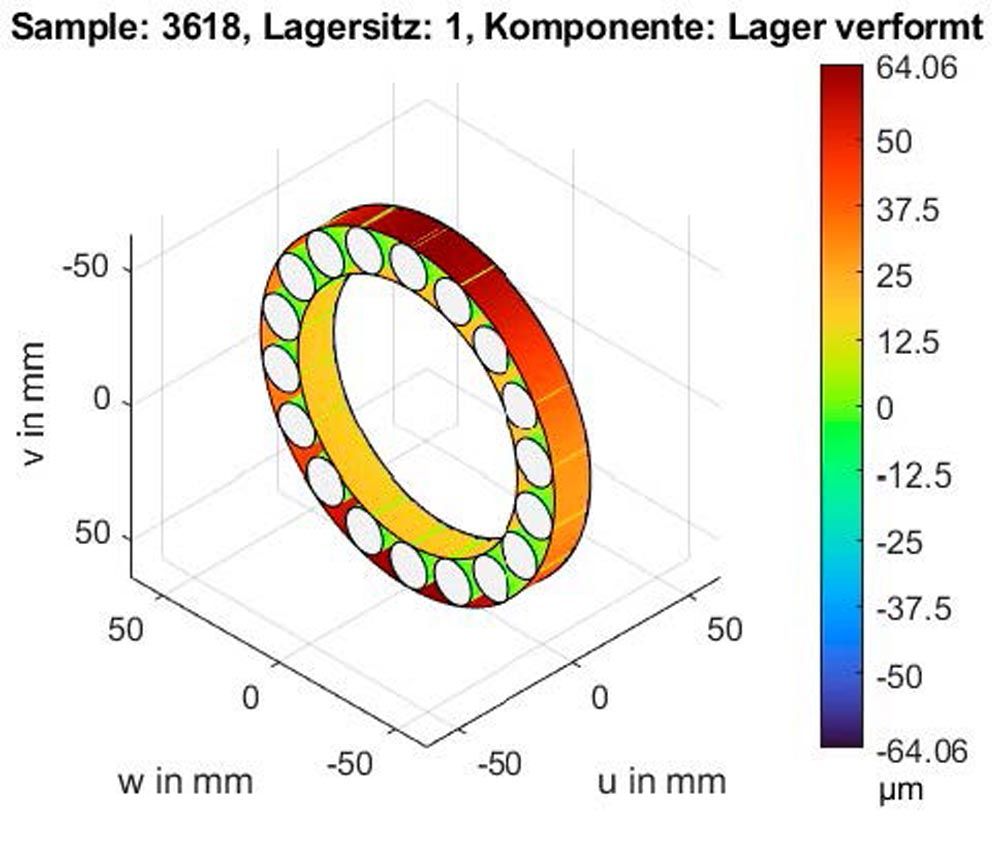 Max. lifetime bearing
 Min lifetime bearing I
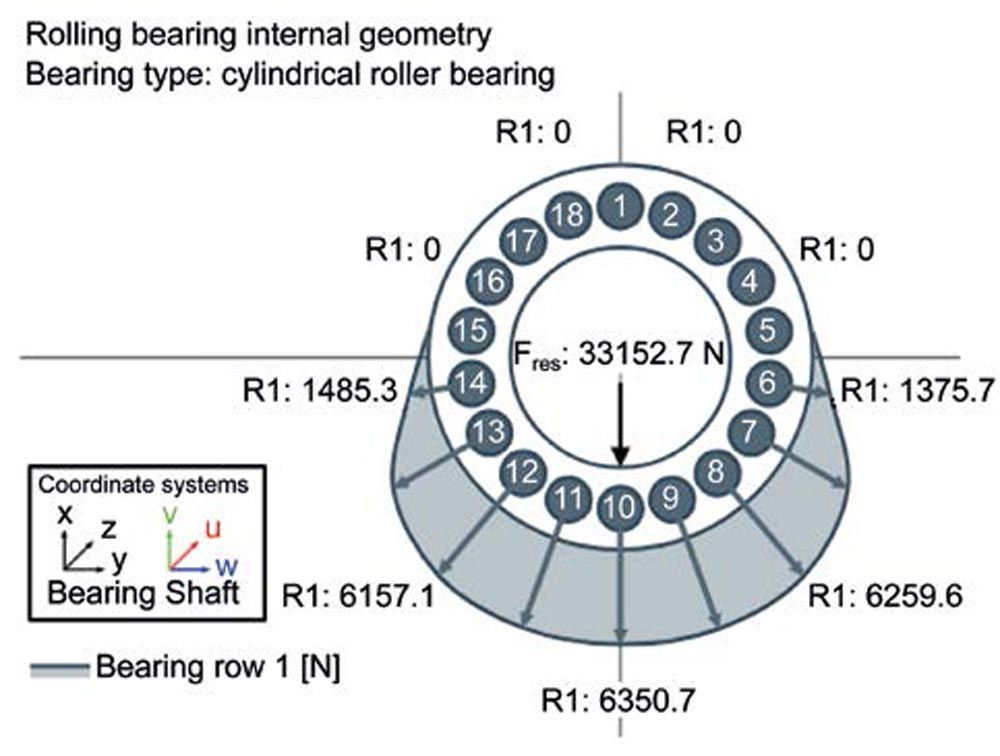 Max lifetime bearing
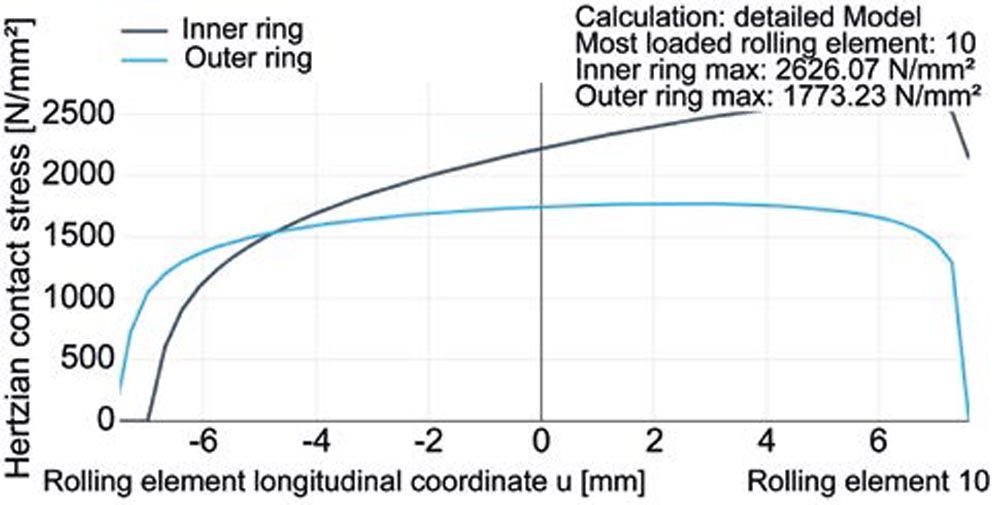 Min lifetime bearing I
 Max lifetime bearing
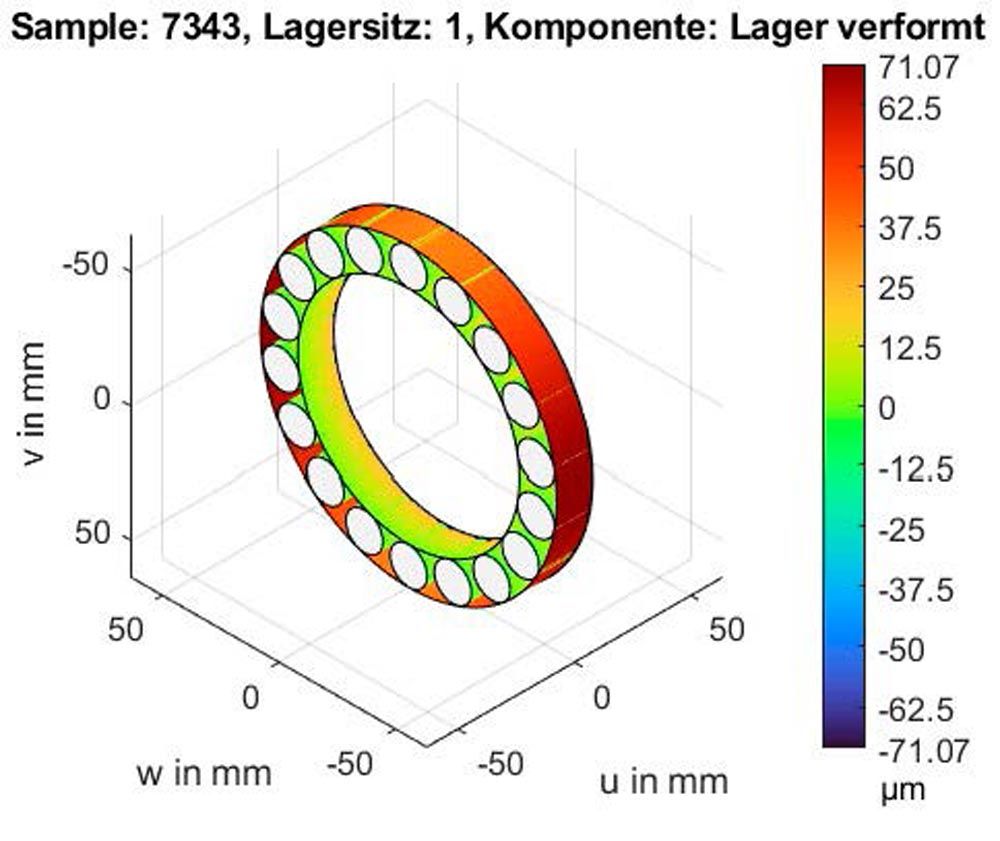
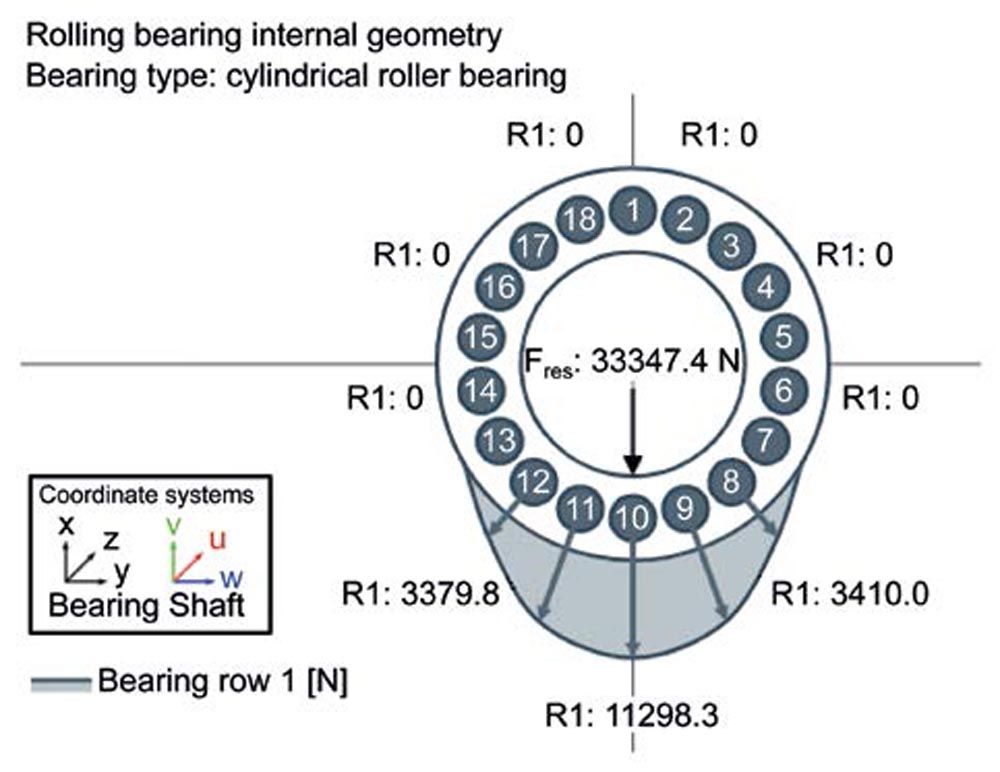
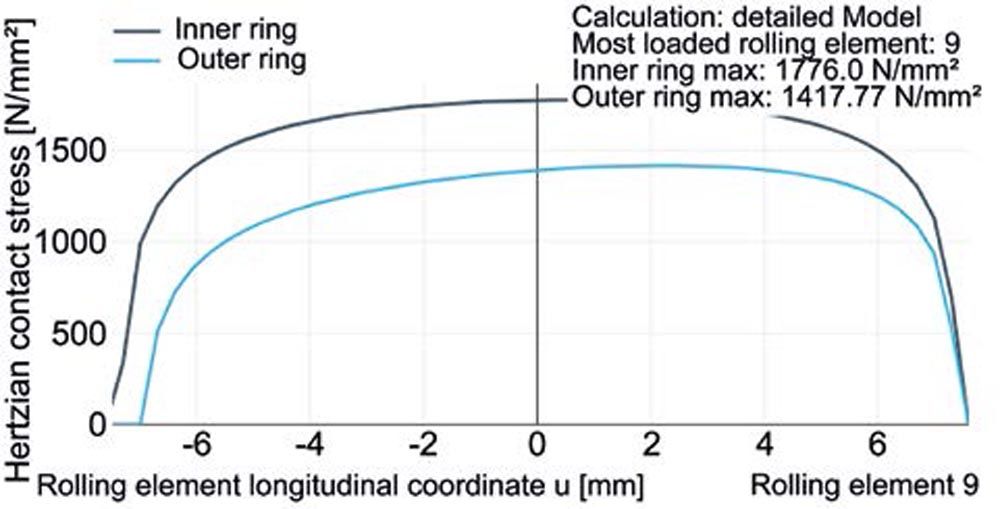
Figure 7—Raceway geometry (top), rolling element load distribution (middle), and axial pressure curve at the most heavily loaded rolling element (bottom) with
minimum (top) and maximum (bottom) lifetime Lnmrh on Bearing I.
By comparison, Figure 7 shows a visualization of the raceway geometries as well as the associated rolling element load distribution and axial pressure curves for the samples with minimum and maximum (noted above) lifetime Lnmrh of Bearing I. As can be seen, there is clear ovalization of the outer ring raceway in both cases. For the sample with maximum lifetime, the value is 18.06 µm. The large semi-axis is aligned parallel to the load. In this case, the inner ring raceway shows a taper with a negative pitch in the u-direction. The associated lead angle is -0.98 angular minutes.
Here, the lifetime Lnmrh of 13721 h is more than double the mean value of 6096 h for Bearing II, which is due to the positive influence of the geometric deviations on the internal bearing load conditions. In comparison to Bearing II, the ovalization leads to a more uniform load distribution on the rolling elements, and thus a significant reduction in the peak load (compare Figure 6 top and Figure 7 middle-right). While the maximum rolling element load is 9330.60 N for Bearing II, in the best case it is only 6350.70 N for Bearing I.
The taper on the inner ring compensates for the bending of the shaft. As a result, the axial pressure curve of the inner ring is almost symmetrical to the center line. The maximum Hertzian pressure sinks to 1776.0 MPa compared to 2102.47 MPa for Bearing II (compare Figure 6 bottom and Figure 7 bottom-right). This is also a result of the reduced rolling element load.
On the other hand, the geometric deviations have the opposite effect for the sample with the minimum lifetime. In this case, the bearing lifetime is greatly reduced to 1273 h compared to the mean value of 6096 h for Bearing II. Here, too, the outer ring is ovalized. The amplitude of 18.08 µm is almost the same as in the optimum case. However, the large semi-axis is transverse to the load direction (compare Figure 7 top left and right). This results in a more uneven load distribution on the rolling elements, and thus an additional increase to the peak load on the most highly loaded rolling element compared to Bearing II (11298.30 N, see Figure 7 center-left, compared to 9330.60 N, see Figure 6 top).
The lead angle of the taper is clearly positive (4.94'), which reinforces the axial stress gradient from the bending of the shaft. Instead of uniform load distribution in the circumferential and longitudinal directions as in the optimum case, the higher rolling element peak loads and the axial stress gradient lead to a pronounced maximum local stress at the edge of the most heavily loaded rolling element (maximum Hertzian pressure of 2626.07 MPa, compared to 1776 MPa in the optimum case or the Bearing II median lifetime of 2102.47 MPa, see Figure 6 bottom and Figure 7 bottom). As a result, the expected bearing life decreases significantly.
Conclusion
The example presented in this article clearly shows that geometric deviations of the bearing raceways have a significant influence on the key characteristics of rolling bearings, such as the lifetime considered here. In practice, this can be a result of deformation of the bearing rings during mounting due to bearing seat geometries that are not ideally cylindrical, for example. The effect depends on the bearing type and size as well as the operating conditions. However, this is not necessarily negative, and can even be clearly positive. The FVA-Workbench allows users to directly consider geometric deviations in bearing design. The integrated scripting interface also makes it possible to integrate user-defined calculation routines (e.g., ring deformations determined from FE calculations or statistical tolerance analysis) with little effort.

References
- DIN 26281: Rolling bearings—Methods for calculating the modified reference rating life for universally loaded bearings; Beuth Verlag, Berlin, 2010.
- Schleich, B.; Skin Model Shapes: A New Paradigm for the Tolerance Analysis and the Geometrical Variations Modelling in Mechanical Engineering. Dissertation Friedrich-Alexander-Universität Erlangen-Nürnberg, 2017.
- Fingerle, A.; Hochrein, J.; et al.; “Theoretical Study on the Influence of Planet Gear Rim Thickness and Bearing Clearance on Calculated Bearing Life.,” Journal of Mechanical Design, Vol. 142, No. 3, 2020.
- FVA Workbench: https://www.fva-service.de/en/software/
- Guyan, R.; “Reduction of Stiffness and Mass Matrices,” AIAA Journal, Vol. 3, No. 2, 1965.
- FVA-Workbench Scripting Interface Documentation: https://doc.fvaservice.de/80/en/scripting.html
- DIN 620-4: Rolling bearings—Rolling bearing tolerances—Part 4: Radial internal clearance; Beuth Verlag, Berlin, 2004.
- Siebertz, K.; van Bebber, D.; Hochkirchen, T.; Statistische Versuchsplanung, Design of Experiments (DoE), Springer Verlag, Berlin, Heidelberg, 2017.
- Teutsch, R.; Sauer, B.; “An Alternative Slicing Technique to Consider Pressure Concentrations in Non-Hertzian Line Contacts,” Journal of Tribology, Vol. 126, No. 3, 2004, pp. 436-442.
fva-service.de