ISO 81400-4, (Ref. 1), states “…The required design life shall be specified for each of the major subsystems of the gearbox including gears, bearings, housings, shafts and seals….” In this statement, attention is directed to the underlying reliability of the material data or load capacity numbers associated with the life calculation of components. For the bearing rating, design rules (Refs. 1–3) usually stipulate a bearing failure probability of 10%. If in a gearbox each bearing reaches the required life Hreq (e.g. 175,200 h = 20 y, using Lnmrh along (Ref. 4)) at a probability of failure of F = 10%, the reliability of the bearing subsystem is less than 90%. The reliability of the bearing subsystem is the product of all bearing reliabilities.
Single bearing reliability calculation. In B20 revision of AGMA 6006, (Ref. 2)), bearing reliability R(t) as a function of time t is calculated with a three parameter Weibull distribution:
Bearing Subsystem Life and Reliability
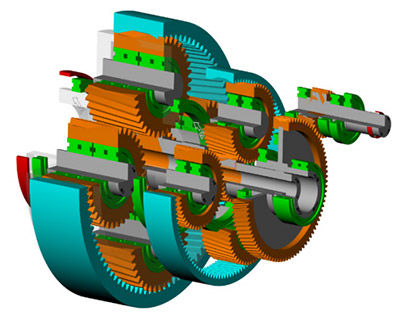
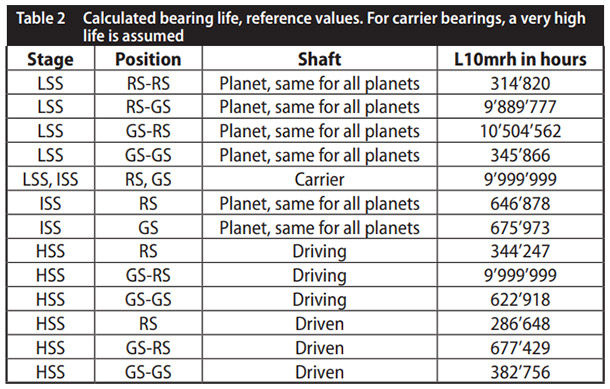
Base line model and reference conditions. The bearing subsystem of a 3MW class main gearbox is investigated. The rotor shaft is supported by two bearings; planet carrier bearing life is assumed as “infinite.”
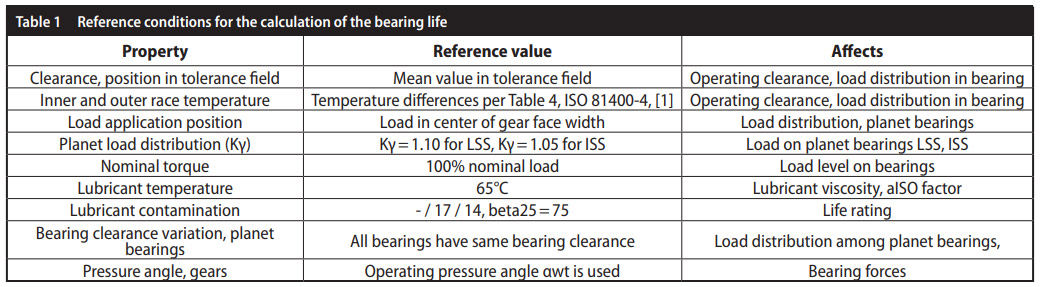
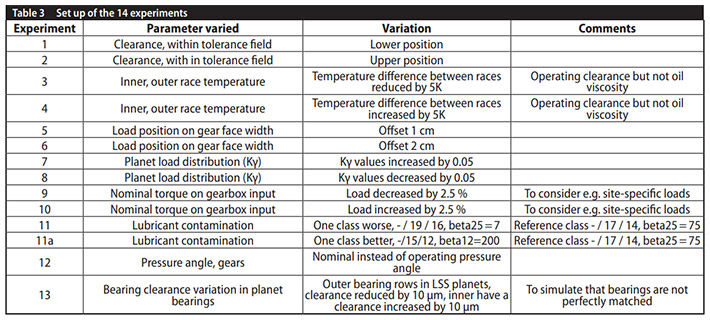
Different effects are considered in the calculations. From a reference condition listed below, small changes are introduced to study how they affect the reliability of the bearing subsystem.
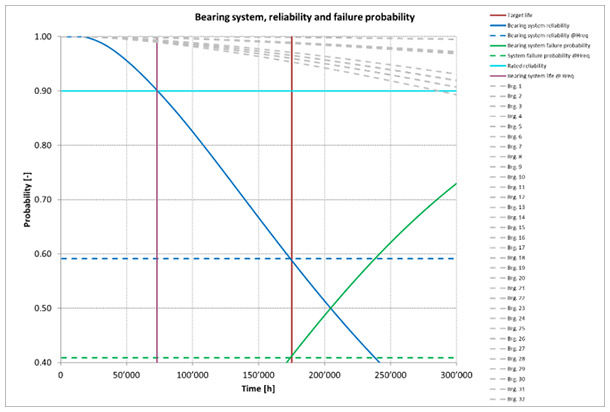
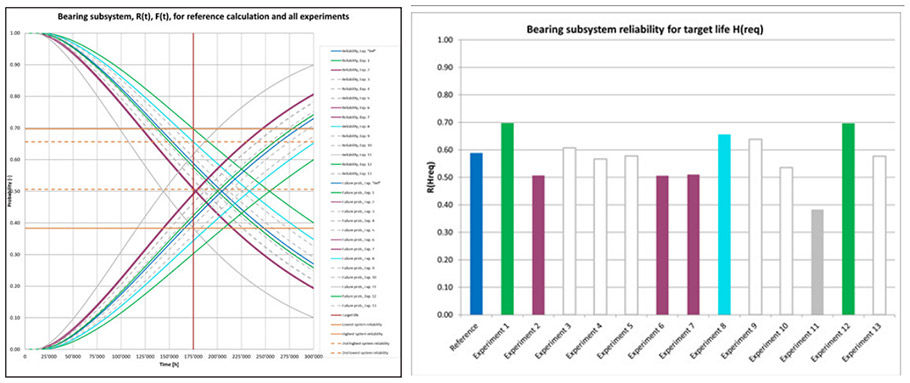
Bearings reliability (grey), subsystems reliability (blue), required subsystems life Hreq (vertical, red), rated reliability (horizontal, cyan), subsystem reliability at required life (horizontal, dashed blue), subsystem life at rated reliability (vertical, pink).
Results, reference calculation. With settings per DNV GL guideline (Ref. 3) and above, calculations are done using KISSsoft software (Ref. 1), giving:
For all 32 bearings, the reliability function R(t) is plotted (see figure 2 in grey). Bearing subsystem reliability (blue) is calculated therefrom. The intersection of subsystem life Hreq at 175,200 hours (vertical, red) and the time dependent subsystem reliability (blue) results in a subsystem reliability value of about 0.59 (blue, dashed, horizontal line).
Variation of Calculation Settings
Parameters varied. Thirteen experiments are set up. Only one parameter is changed compared to the reference calculation.
Resulting reliability curves. For each experiment, for all bearings, life and reliability curve are calculated. Bearing subsystem reliability and failure probability curve is plotted in (Figure 3). The resulting reliability values for the required life Hreq are determined as intersection of the reliability curves with the vertical line at x = Hreq. Experiment 1 and 12 gave highest reliability, highlighted (green). Experiment 8 gave second highest reliability (cyan). Experiment 2, 6 and 7 gave second-lowest reliability, (pink). Experiment 11 gave lowest reliability (grey, solid line).