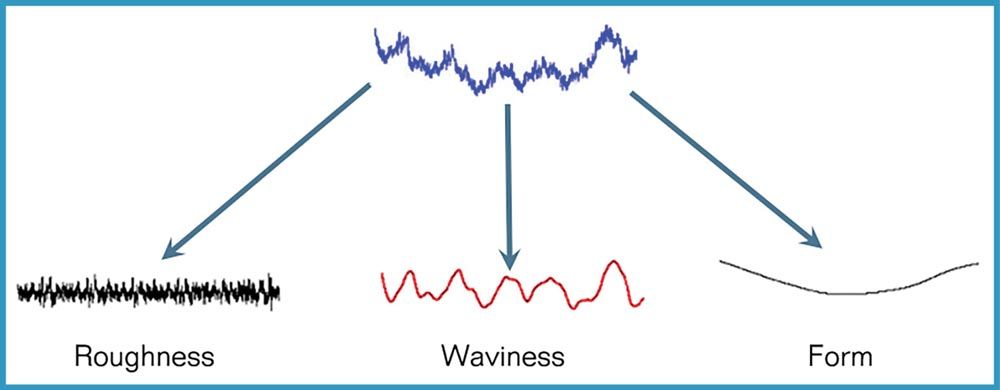
Figure 1—Surface texture consists of roughness (left), but also waviness (center) and form error (right).
Mike Zecchino and Mark Malburg, Digital Metrology Solutions
It’s common to hear “surface roughness” described as a number that can be measured on a gage. But describing surface texture with a number is a lot like describing a concert in decibels: loudness is just part of the story. A rock band, an orchestra, and a chainsaw can all produce 100 decibels, but the full picture is much more complex and interesting.
Surface roughness (or more generally “surface texture”) is more than a number: it is the shape of the surface. For powertrain components, texture affects all aspects of performance, from vibration and noise to sealing, wear, thermal characteristics, etc. To create durable surfaces that perform well, we need to understand which aspects of the texture matter for the given application. The finish of a gear, say, will have different requirements than that of a cam, or a sensor component.
In this article we look at the nature of surface texture, how it’s measured and analyzed, and what we need to control to produce high-performing components.
As measurement equipment and software have advanced, the technology has shaped our understanding of surface texture. Rather than thinking of a surface as having a generalized “roughness,” we can more properly describe surface texture as a range of features of varying sizes. We describe the size of these features in terms of “wavelengths,” from short-wavelength roughness to longer-wavelength “waviness” and “form error.”
Figure 2—A stylus measurement of surface roughness on a shaft (left), and a 3D measurement of the surface texture (right). These measurements show both the roughness and a larger, residual tooling pattern, both of which may impact the performance of the part.
Roughness testers, or roughness gages, are the most widely used instruments for measuring surface texture. These typically handheld gages measure texture by moving a stylus across the surface. The stylus follows the surface texture, resulting in a two-dimensional “profile” (Figure 2, left). Non-contact, optical measurement techniques produce 3D texture data (Figure 2, right).
The measurements in Figure 2 show the finer roughness peaks, but also a larger, periodic shape remaining from machining. Both aspects of the texture may affect the component’s performance, and both may need to be controlled independently.
Surface roughness is often specified using parameters such as average roughness (Ra), which describes how much the surface deviates from a mean height. A “rougher” surface generally has a larger Ra value.
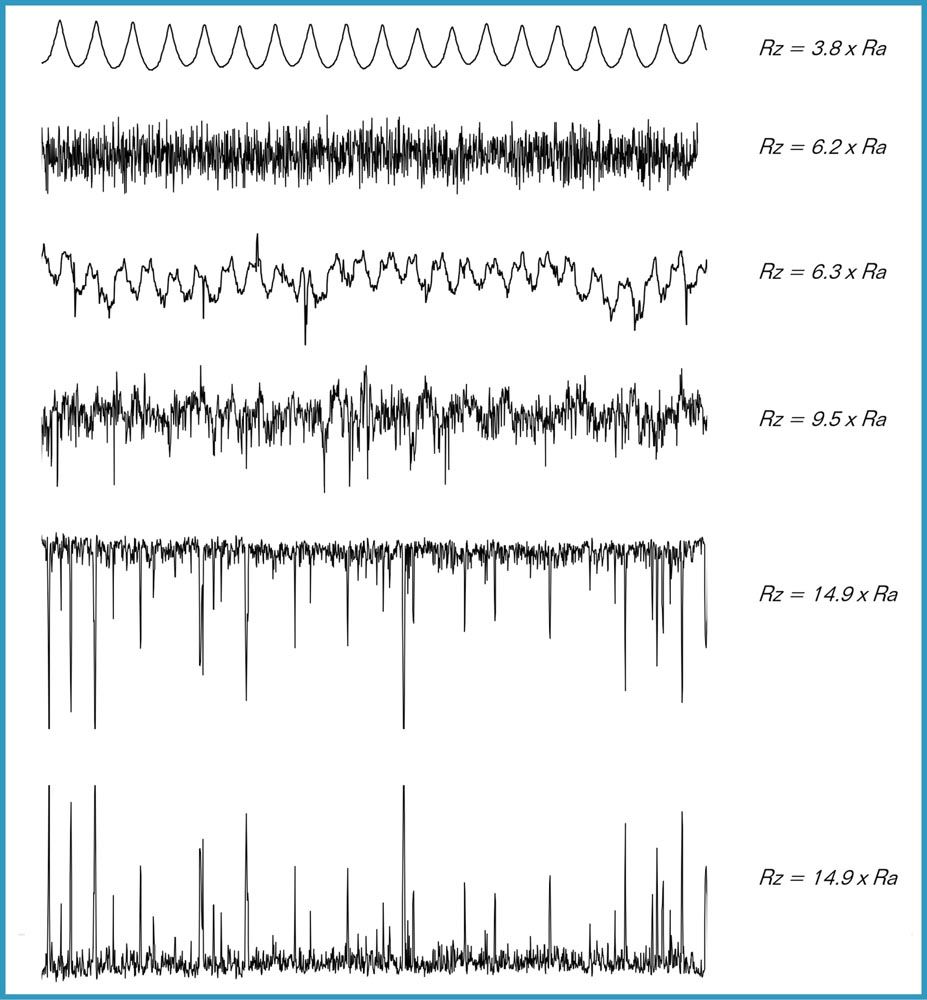
Figure 3—Very different surfaces, all with the same Ra value. Courtesy of The Surface Texture Answer Book.
The challenge, however, is that very different surfaces can produce the same Ra value. Figure 3 shows five surfaces with the same Ra but very different characteristics. All these surfaces might pass a specification for Ra. But will the component leak or seal? Will it run quietly or chatter, or squeal? Ra may not help us to tell the difference, because it does not differentiate peaks from valleys, or narrow spacings between peaks/valleys from wide spacings. If these aspects of the texture will affect the component’s function, then other surface texture parameters than Ra may need to be specified and tracked.
To examine roughness and waviness, we separate surface texture into its component wavelengths through the process of “filtering.” A filter attenuates texture above or below a set wavelength. The “roughness cutoff,” for example, separates the data into shorter-wavelength roughness and longer-wavelength waviness (Figure 4).
Figure 4—Separating surface texture (top) into longer-wavelength waviness (middle) and shorter-wavelength roughness (bottom). Both aspects of the texture may be critical to the part’s function. Courtesy of The Surface Texture Answer Book.
Filtering allows us to control the texture that matters for the application. For the milled surface in Figure 4 (top), we can filter out the roughness wavelengths to clearly see the pattern of tooling marks. When we remove the longer wavelengths corresponding to the tooling marks, we see the finer roughness.
“Roughness” and “waviness” are not fixed ranges of wavelengths—they vary based on the application. For example, the profile measured along a shaft in Figure 5 shows larger structures in the waviness and fine tooling marks in the roughness. Both will affect loading and durability of the shaft as it rotates inside a bushing. However, even those larger structures in the waviness here would be small compared to the roughness of, say, a clutch plate or brake rotor.
Figure 5—A profile measurement of a shaft section. The top plot shows the waviness (red) superimposed on the primary profile. The bottom plot shows the roughness (with waviness removed).
It’s critical to understand that altering the roughness may have little or no effect on waviness, and vice versa. Polishing a cam to a mirror finish, for example, may not impact the waviness at all, and that waviness could lead to chatter and premature wear. For seals and other components, this kind of polishing could result in parts that pass roughness inspection but fail in actual performance, because larger-scale waviness may create leak paths that a roughness measurement would miss.
Early measurement systems only provided a handful of roughness parameters such as average roughness, RMS roughness, maximum peak-to-valley height, and possibly waviness. As measurement technology and processing capability have advanced, dozens of parameters have been developed to track additional aspects of the texture, such as spacings between peaks, the ratio of peaks versus valleys, etc. (Figure 6). All these parameters were developed to track aspects of texture that affect part performance but could not be discerned by more basic parameters.
Figure 6—Analysis software includes many parameters to control various aspects of the surface texture. TraceBoss software courtesy Digital Metrology.
The choice of which parameters to specify and control depends, again, on the application. If rough peaks represent a potential issue for sealing, or sufficiently deep valleys are required to retain lubrication, then parameters can be specified to control these aspects of the texture.
The world of surface texture goes far beyond a single number definition. To produce quality surfaces, we need to be able to see and understand what matters about the texture for the application. Many resources are available to learn about surface roughness/texture, including short videos, tutorials, books, and sample data available through digitalmetrology.com.